FIGURE 1.

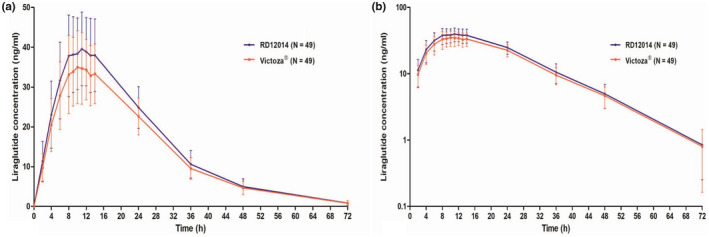
Mean plasma concentration‐time profiles of liraglutide after a single 0.6 mg subcutaneous administration of Victoza or RD12014. (a) Linear scale; (b) semilogarithmic scale. The error bars are SD.

Mean plasma concentration‐time profiles of liraglutide after a single 0.6 mg subcutaneous administration of Victoza or RD12014. (a) Linear scale; (b) semilogarithmic scale. The error bars are SD.