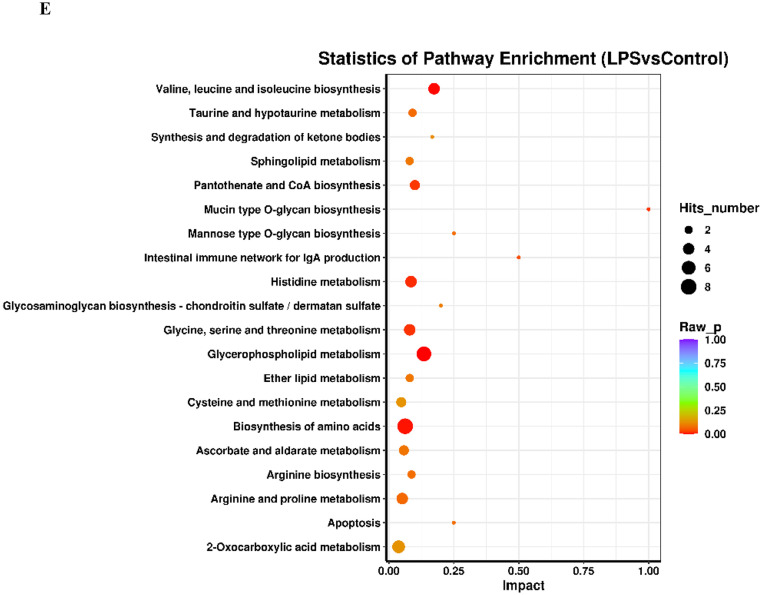
Figure 3.
Analysis of metabolic alterations of the Control and Model samples. (A) OPLS-DA score plots of metabolite profile; (B) Permutation test on the OPLS-DA model; (C) Hierarchical clustering of differential metabolites in the comparison Model vs. Control and (D) VIP plots from pairwise OPLS-DA analyses of groups: Model vs. Control; (E) Metabolome view from pathway analysis performed using MetaboAnalyst.


