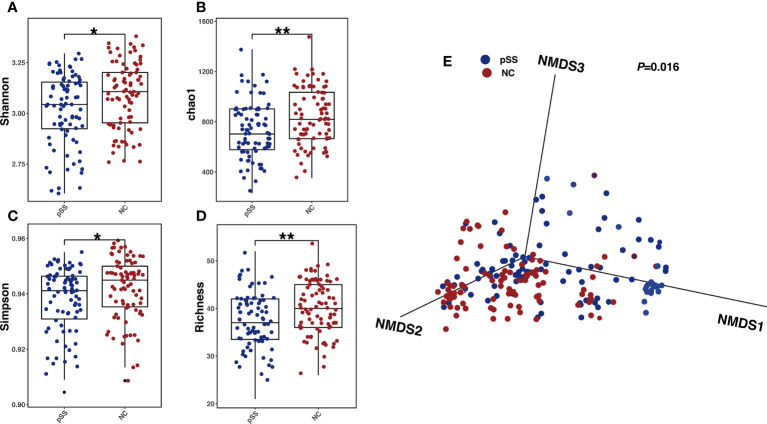
Figure 1.
Gut microbial alterations in pSS patients compared with healthy controls. Comparison between Gut microbial profile of samples from healthy controls and pSS participants. (A) Shannon index between groups revealing microbial richness and particular evenness(alpha-diversity); P-values were calculated by Wilcoxon rank-sum test; (B) Simpson index levels of healthy controls and pSS participants; P-values were also calculated by Wilcoxon rank-sum test. (C) Richness of Gut microbial profile of samples in two groups with P-values calculated by Wilcoxon rank-sum test. (D) Chao 1 index and the number of species with P-values yielded from Wilcoxon rank-sum test.”**”: adjusted P-values “<0.01”,”*”:adjusted P-value “<0.05”. (E) NMDS analysis revealing β diversity based on Bray-Curtis Distance, with R2 and p value calculated from Adonis analysis.

