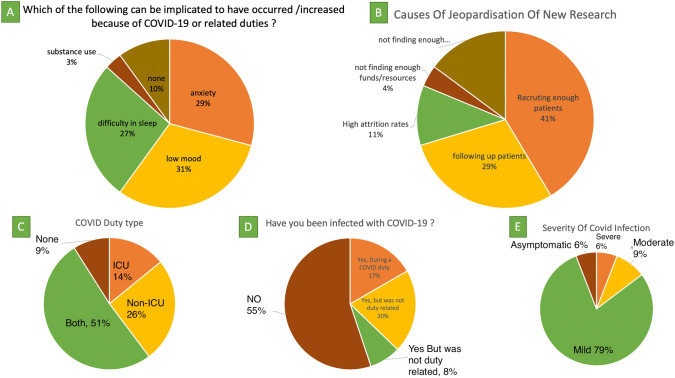
Fig. 4.
Pie charts are made from separate multiple choice question responses to understand the attitude of trainees towards different aspects of training. A Pie chart represents personal difficulties created by COVID related duties; B different causes for retraction of new research; C type of COVID posting; D exposure to COVID infection; and E severity of COVID infection across trainees

