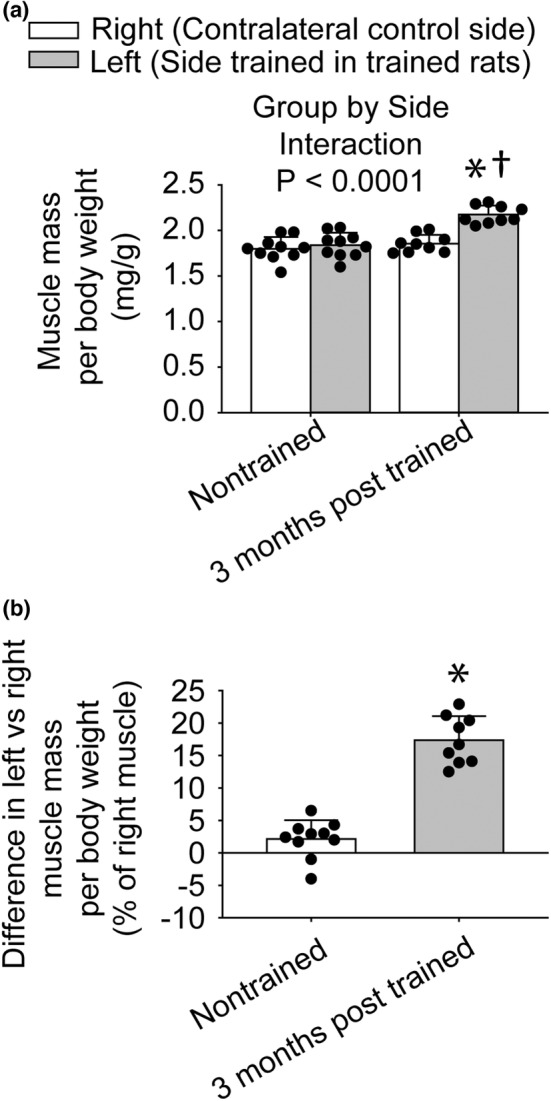
FIGURE 4.

Increased muscle mass persisted 3 months following training. For trained rats, left muscles were exposed to the training while right muscles were not. For nontrained rats, both left and right muscles were not trained. Muscle mass assessment was performed by normalizing muscle mass to body weight (a) and expressing the difference between left and right normalized muscle masses as a percentage of right normalized muscle mass (b). The sample size was N = 9–10 per group. Dots represent individual data values. Bar graphs and error bars represent means ± SD. *value for right muscles distinct from left value, †value for 3 months posttrained different from the value for nontrained, p < 0.05.
