Figure 6.

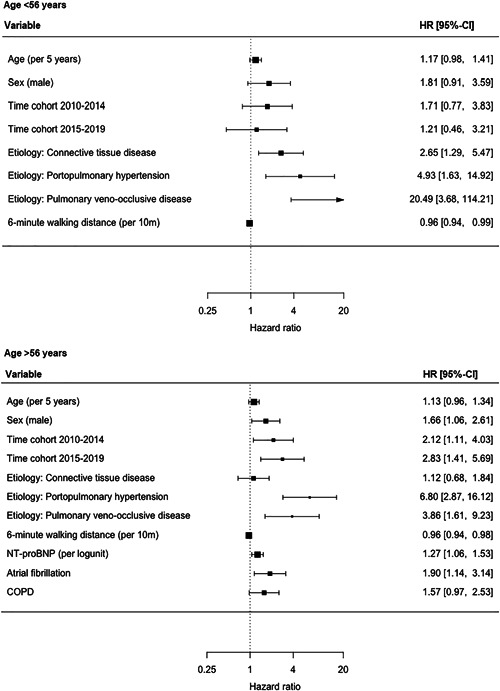
Forest plots of multivariable cox‐PH regression of subpopulations based on age. CI, confidence interval; COPD, chronic obstructive pulmonary disease; HR, hazard ratio; NT‐proBNP, N‐terminal pro‐brain natriuretic peptide.

Forest plots of multivariable cox‐PH regression of subpopulations based on age. CI, confidence interval; COPD, chronic obstructive pulmonary disease; HR, hazard ratio; NT‐proBNP, N‐terminal pro‐brain natriuretic peptide.