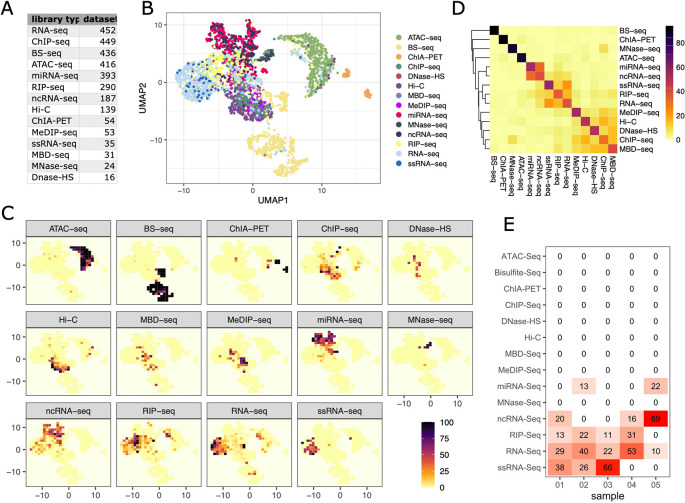
Figure 2. Library types can be distinguished by their base compositions.
A) Number of samples per library type included in the analysis. B) UMAP representation of library compositions (reference map). C) Tile based probability map for each library type. Colour represents the percentage of a particular library type per tile. D) Heatmap illustrating the specificity of each library type for tiles of the reference map. All samples were assigned to a reference map tile and colour represents the average percentage of each library type for these tiles. E) Librarian tile probability output: Percent of each library found in the reference map tile associated with the test library.

