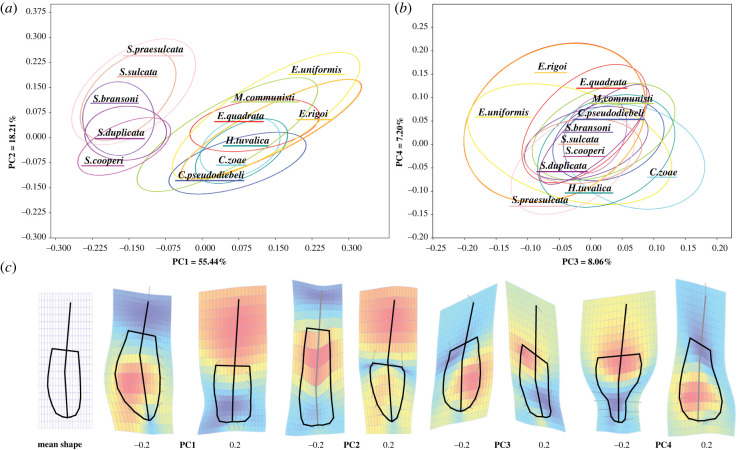
Figure 3.
Principal component analysis of the morphologies of segminiplanate elements at the DC and CN boundaries. Scatterplots of the considered specimens on the PC1-PC2 plane (a), and PC3-PC4 plane (b) of the morphospace. Each species is coded by a distinct colour. The poorer data of Siphonodella isosticha and Siphonodella quadruplicata are not displayed here but available in the electronic supplementary material . The ellipses correspond to 95% of the variance of the corresponding species. In both planes, the ellipses appear aligned with one another, suggesting conservation of the patterns of intraspecific variation over large temporal and phylogenetic scales. (c) Thin-plate-splines deformation plots of each of the four significant principal components (PCs) relative to the consensus shape (left). Black lines connect landmarks to visualize reconstructed shape at given PC values. The hot-cold colour scale represents the expansion factors, the arrows represent the deformation vectors from consensus to given PC value (see [37]). (Online version in colour.)

