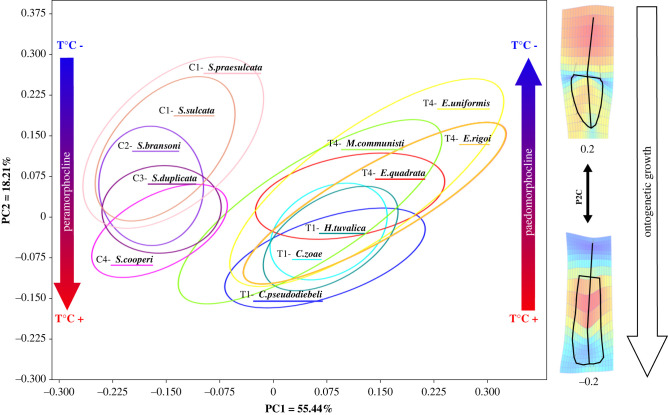
Figure 5.
The direction of the heterochronic shifts at DC and CN boundaries may have been controlled by ocean temperature changes. Evolution at both boundaries parallels the PC2 axis (figure 3; electronic supplementary material). Ontogenetic growth also parallels the PC2 axis (figure 4), whereby low PC2 values correspond to developmentally older specimens and high PC2 values to younger specimens. The peramorphocline of DC siphonodellids corresponds to a global warming, the paedomorphocline of CN taxa to a global cooling, hence lower values of PC2 and mature forms correspond to higher temperatures. (Online version in colour.)

