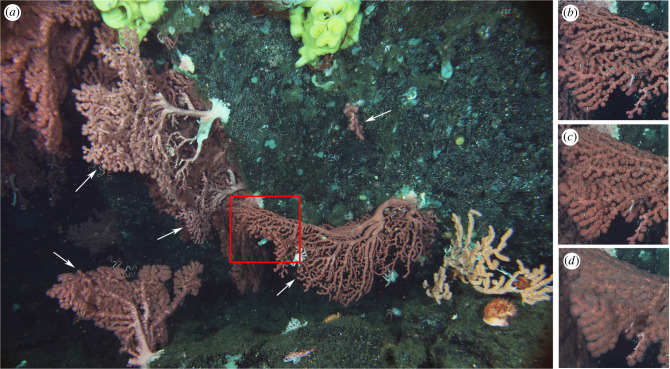
Figure 2.
Image-based quantification of feeding activity. (a) Field of view of the time-lapse camera deployed on Sur Ridge between March 2020 and March 2021. Arrows point at the five Paragorgia arborea colonies annotated to quantify feeding activity. (b–d) Photographs representing coral branches (section of colony delineated by the red square) with retracted (closed; (b)), inflated (intermediate; (c)) and extruded (open; (d)) polyps. (Online version in colour.)

