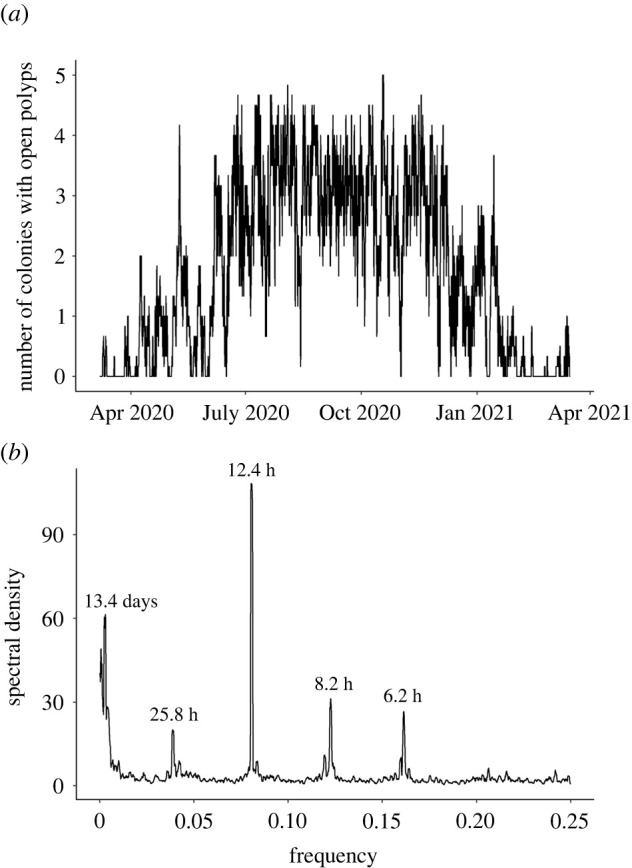
Figure 3.

Temporal dynamics of feeding activity between March 2020 and March 2021. (a) Time series of the number of colonies with open polyps (feeding activity). The moving average over 12 h is represented. (b) Periodogram representing the dominant periods (1/frequency; unit = hours) in the feeding activity time series. Visible peaks represent the relative importance of the different frequencies in explaining oscillations in the time series.
