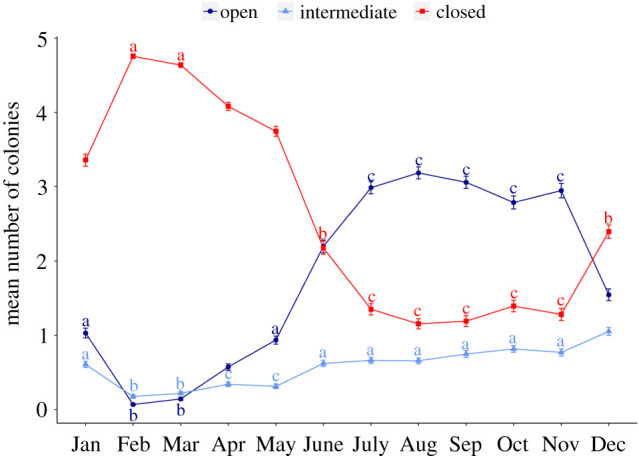
Figure 4.

Mean (± s.e.) number of colonies with retracted (closed), inflated (intermediate) or extruded (open) polyps per month between March 2020 and March 2021. Letters represent statistical significance between months for each feeding category (colour codes) based on GLMM (alpha = 0.05, Tukey-adjusted): identical letters indicate equality within a given feeding category. (Online version in colour.)
