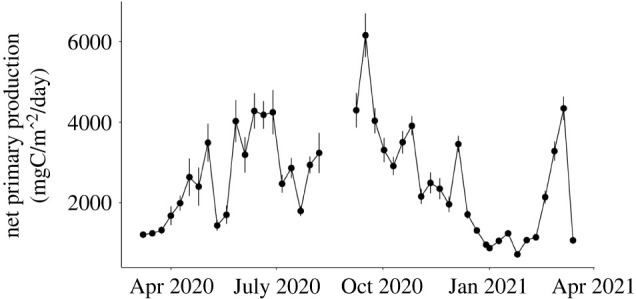
Figure 5.

Time series of net surface primary production within a 100 × 100 km area centred above Sur Ridge between March 2020 and March 2021. Time points represent 8-day averages (± s.e.). Data were downloaded from the Ocean Productivity website (http://sites.science.oregonstate.edu/ocean.productivity/).
