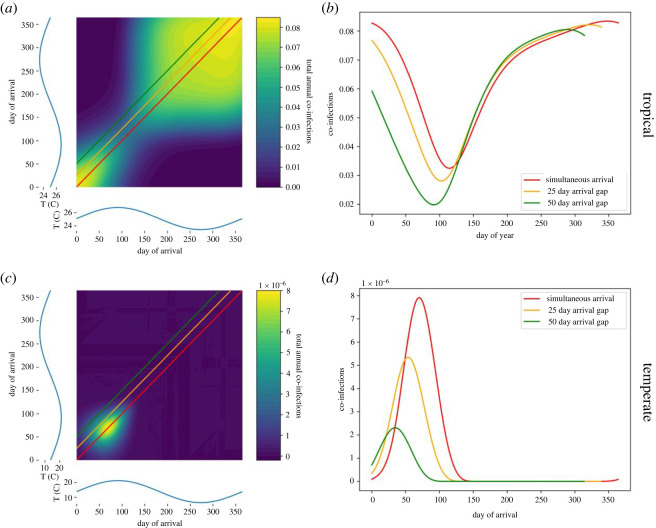
Figure 2.
Seasonal temperature and co-infection responses under different temperature regimes. Fill colours indicated total co-infections observed in a year (or the attack rate), rather than an instantaneous measurement, given each possible combination of virus importation dates. Temperature curves are shown in blue on each axis of the contour plots, and approximate those in Rio de Janeiro ((a,b), 25.1°C, amplitude 3.4°C), and those in Beijing ((c,d), mean 13.8°C, amplitude 14.7°C). Coloured lines on each plot show how the attack rate observed in each year changes, given different intervals between virus importation dates.

