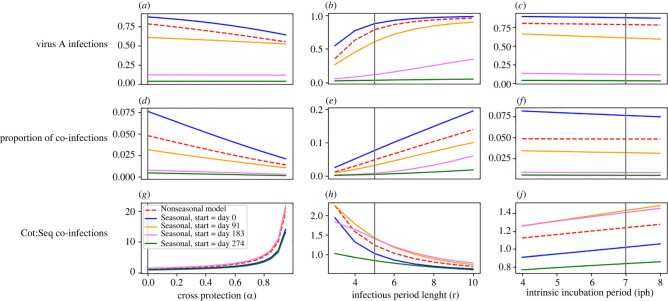
Figure 3.
Univariate sensitivity to temperature-independent parameters under seasonal and non-seasonal models. Varying initial importation dates of virus A were considered when the seasonal model was used to explore the range of temperature environments possible within a year. Vertical lines indicate the baseline value for each parameter, and y-axes differ for each subplot. Panels (d–f) show the proportion of all infections that are co-infections. Panels (g–j) show the ratio of co-transmitted co-infections to sequentially transmitted co-infections.

