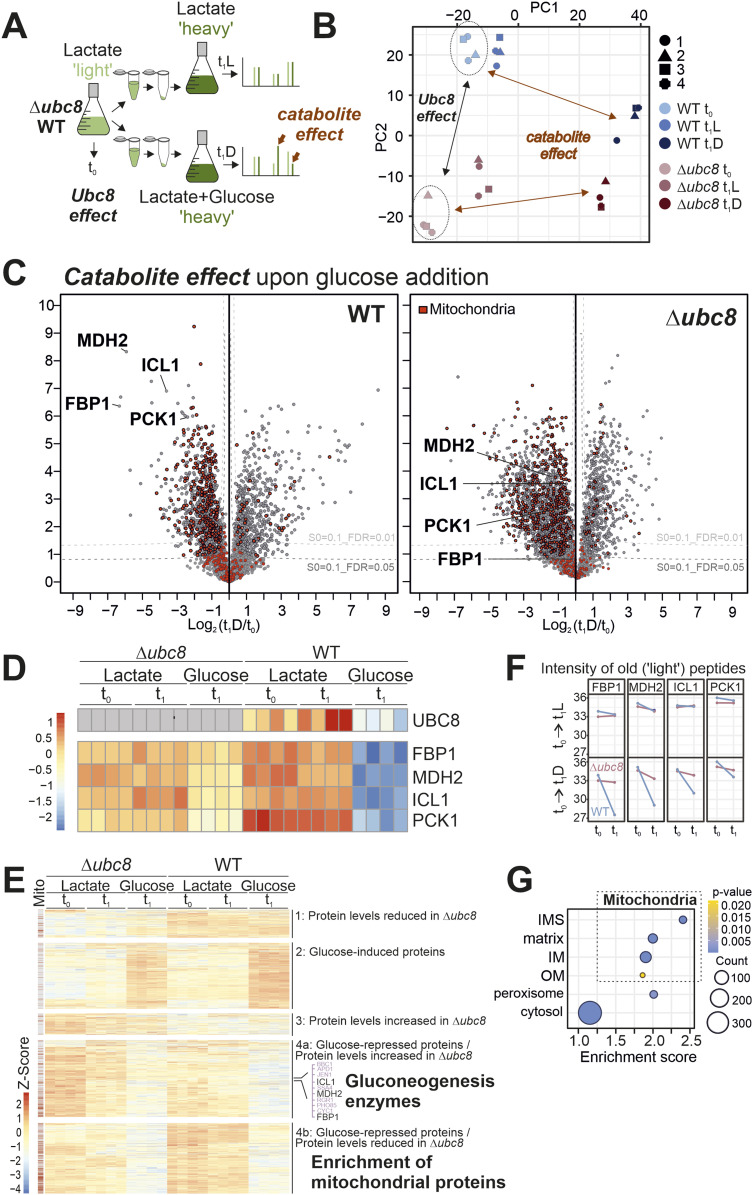
Figure 2. Ubc8 promotes catabolite degradation and influences levels of mitochondrial proteins.
(A) Schematics of the proteomics workflow. (B) Principal component analysis of the data after normalization (see the Materials and Methods section). The entire dataset of the measurement is shown in Table S1. (C) Volcano plot comparing the whole-cell proteomes after and before the metabolic shift from lactate to glucose medium of WT and Δubc8 cells. Positions of gluconeogenic enzymes regulated by Ubc8-dependent metabolic degradation are labeled in bold. Mitochondrial proteins are highlighted in red (Morgenstern et al, 2017). Corresponding plots for the samples that were further grown on lactate are shown in Fig S3A. The sum of the “heavy” and “light” intensities was used. (D, E) Hierarchical clustering of protein intensities identifies five distinct groups. Positions of mitochondrial proteins are indicated on the left. Gluconeogenic enzymes are found in group 4a. In group 4b, mitochondrial proteins are enriched. Panel (D) selectively shows the heatmaps for gluconeogenic enzymes. See Table S2 for additional information. (F) Intensities in the light channel (“old” peptides) of the indicated proteins at t0 and t1 were plotted. Note that lactate-to-glucose switches induce Ubc8-dependent degradation of gluconeogenic enzymes. (G) Enrichment scores for proteins in group 4b indicate the presence of many components of mitochondrion-specific GO categories.

