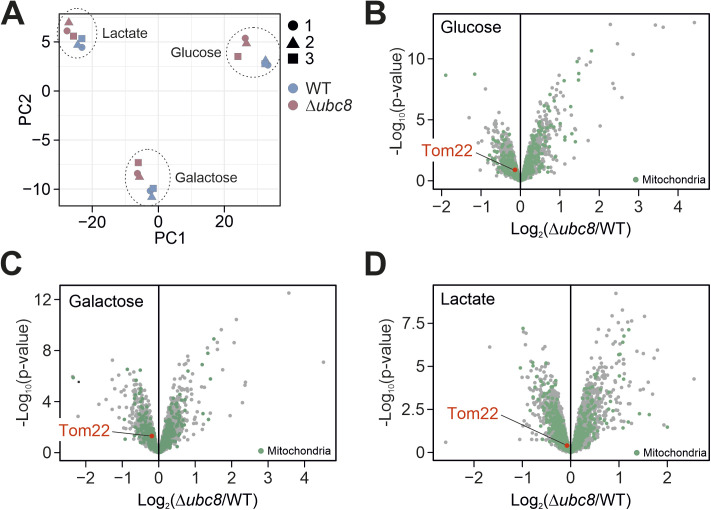
Figure S7. Comparison of wild-type and Δubc8 proteomes after continuous growth in glucose, galactose, or lactate.
(A, B, C, D) Whole-cell lysates of wild-type and Δubc8 cells were continuously grown in glucose, galactose, or lactate medium. Cells were harvested from three independent replicates (n = 3) each and analyzed via mass spectrometry. Panel (A) shows the principal component analysis of the data after normalization (see the Materials and Methods section). Panels (B, C, D) show the individual volcano plots. The entire dataset of the measurement is shown in Table S4.

