
FIG 2.
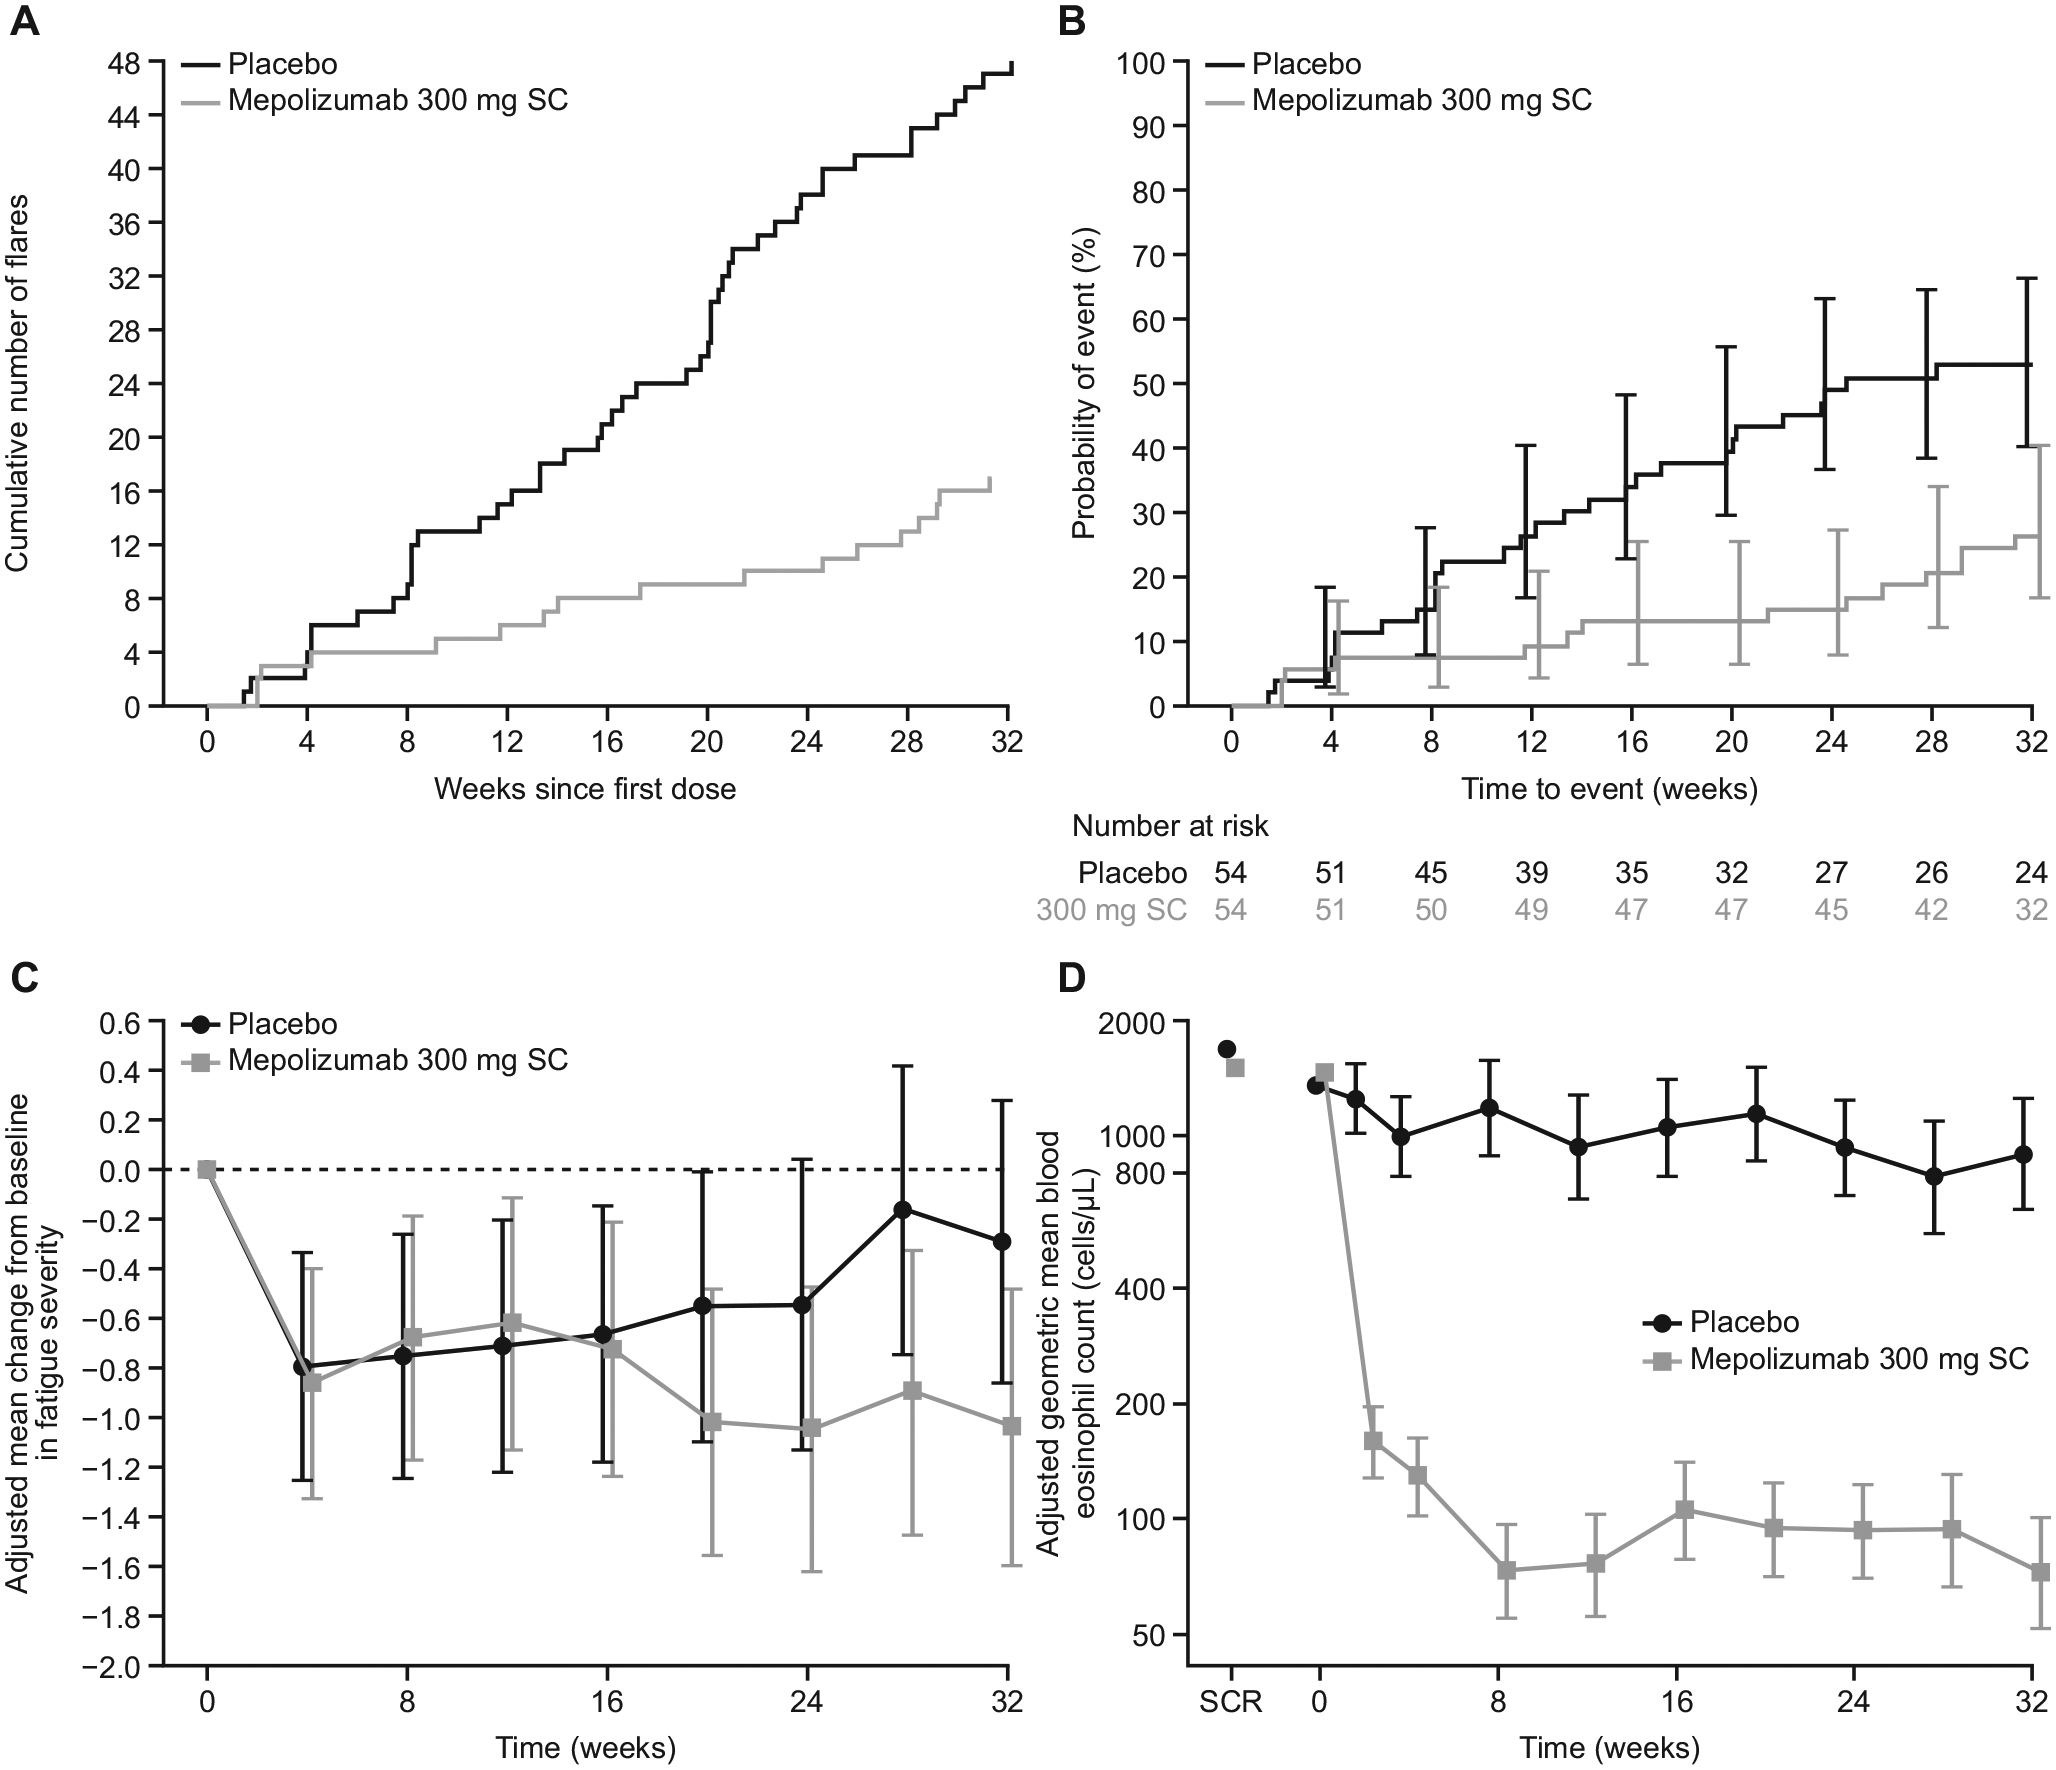
Flares, fatigue severity, and blood eosinophil counts in the intent-to-treat population. A, The cumulative number of flares over the study period. B, A Kaplan-Meier cumulative incidence curve for probability of first flare over time. C, Adjusted mean change from baseline in fatigue severity.* D, The adjusted geometric mean blood eosinophil count over time. Vertical bars in Fig 2, B, C, and D, represent 95% CI. *Fatigue severity assessed on the basis of BFI item 3 recorded daily; for each patient the mean score over the 7 days before each time point was analyzed (range 0–10; higher score indicates worse fatigue severity; minimal clinically important difference for patients in HES not determined). SC, Subcutaneous; SCR, screening.