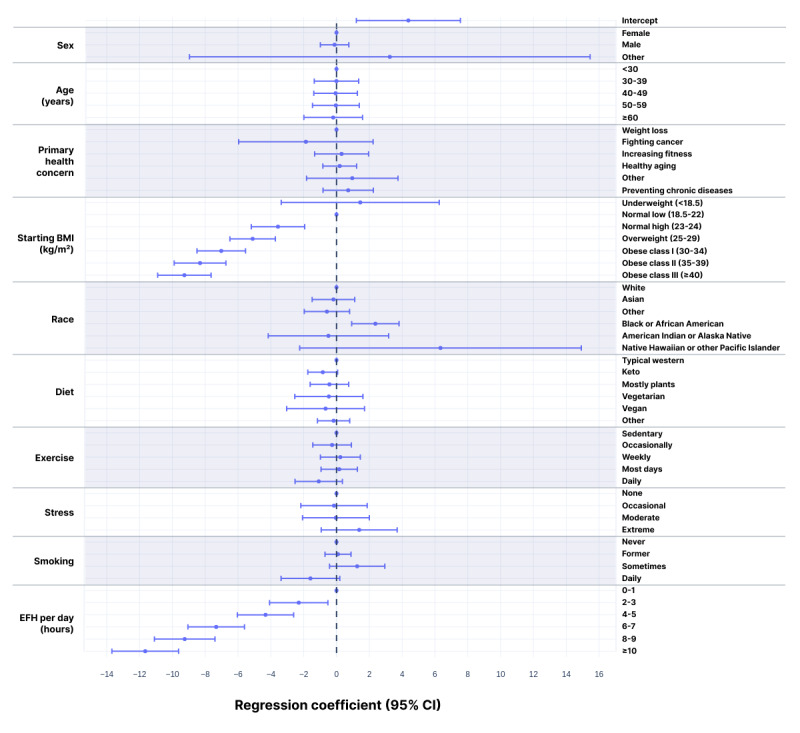
Figure 7.

Regression coefficients with 95% CIs for weight change at 26 weeks. The model was built using ordinary least squares linear regression for the 1252 users who had answers for all variables and a weight recorded in week 26 (R2=0.334). Coefficients are shown as zero for the reference states: female, age <30 years, primary health concern as weight loss, starting BMI in the normal low category, white, typical western diet, sedentary, and never smoker. The regression coefficients reflect the difference in percent weight change at 26 weeks relative to the reference state for that category.
