
Figure 9.
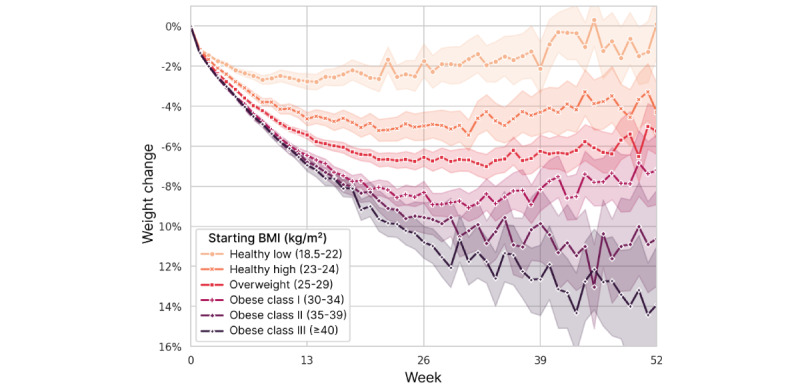
Weight change over time, stratified by user’s starting BMI category. Mean values are plotted with 95% CIs represented by shading.
Official websites use .gov
A
.gov website belongs to an official
government organization in the United States.
Secure .gov websites use HTTPS
A lock (
) or https:// means you've safely
connected to the .gov website. Share sensitive
information only on official, secure websites.
Weight change over time, stratified by user’s starting BMI category. Mean values are plotted with 95% CIs represented by shading.