
Extended Data Fig. 2. Tcf1 and Lef1 deficiency does not affect T cell proliferation and signaling in general.
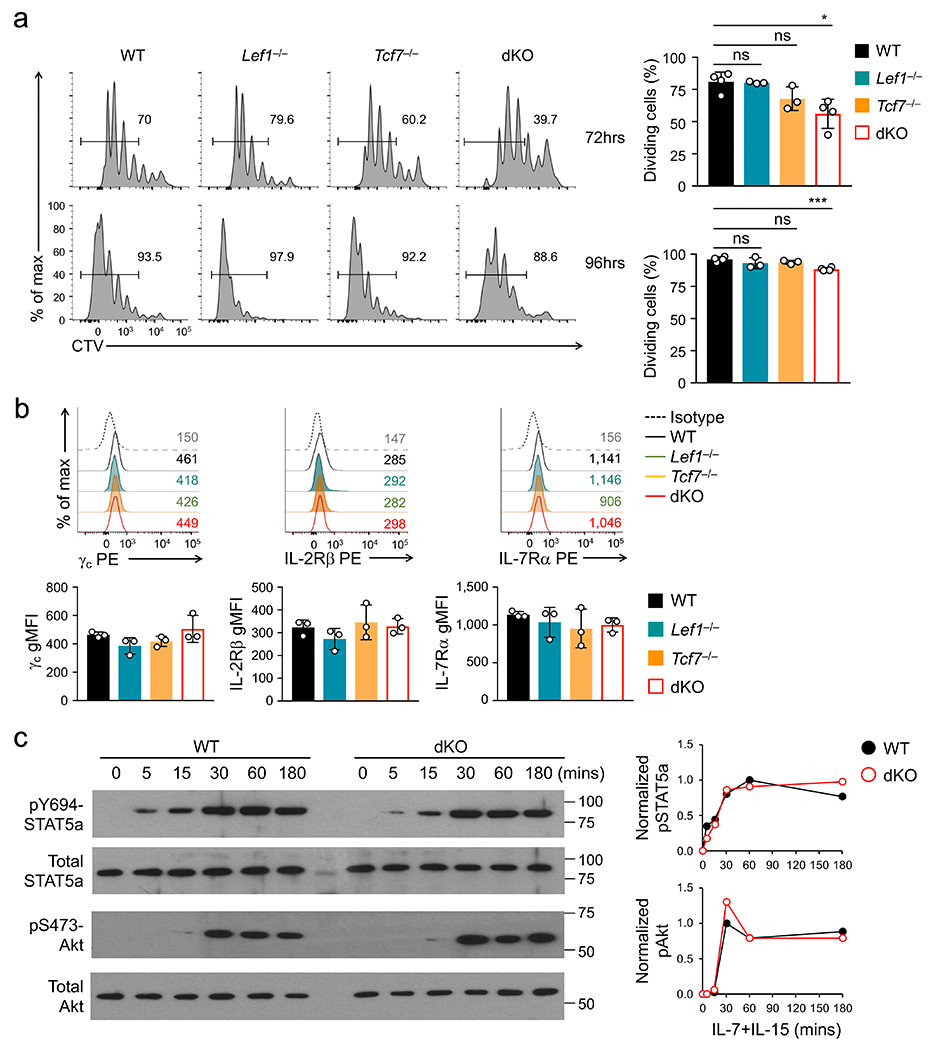
a. Cell division of CTV-labeled naïve CD45.2+GFP+CD8+ T cells at 72 (top) or 96 hrs (bottom) after ex vivo stimulation with plate-bound anti-CD3 in the presence of soluble anti-CD28 and IL-2, with frequency of cells showing ≥1 division summarized (right). Representative histographs are from 3 experiments (left), and cumulative data are means ± s.d. *, p<0.05; ***, p<0.001; ns, not statistically significant by one-way ANOVA coupled with Tukey’s correction. b. Detection of indicated cytokine receptor expression on GFP+CD8+ T cells. Representative half-stacked histographs are from 3 experiments (top), with values denoting gMFI. Cumulative data on gMFI (bottom) are means ± s.d, with no statistically significant differences observed and thus unmarked. c. Detection of Stat5a and Akt phosphorylation in WT and dKO GFP+CD8+ T cells in response to IL-7 and IL-15 stimulation for 0-180 minutes by immunoblotting with indicated antibodies. Gel images are representative from two independent experiments. The signal strength of pY694-Stat5a and pS473-Akt was normalized to respective total protein, and their time-dependent changes were plotted in the right panels. Note that the pY694-Stat5a antibody also detects Tyr699-phosphorylated Stat5b.