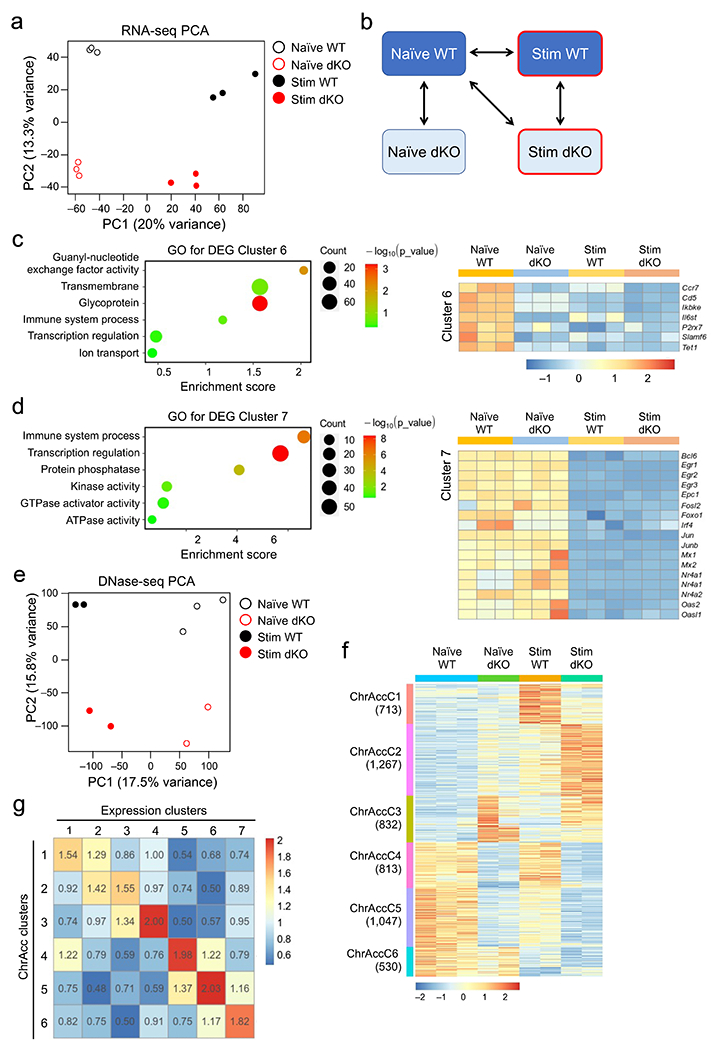
Extended Data Fig. 3. WT and Tcf1+Lef1-deficient CD8+ T cells show dynamic and largely concordant changes in transcriptomic and chromatin accessibility in response to IL-7/15 stimulation.

a. Principal component analysis (PCA) of RNA-seq libraries from WT or dKO GFP+CD8+ T cells before and after 72-hr ex vivo stimulation with IL-7 and IL-15. b. Diagram showing key pair-wise comparisons to define the dynamic transcriptomic and chromatin accessibility changes in this work. c–d. Gene ontology analysis of IL-7+IL-15-repressed genes in ExpC6 (c) and ExpC7 (d), as determined with the DAVID Bioinformatics Resources. Dot size denotes gene counts, and dot color denotes statistical significance. Selected IL-7+IL-15-repressed genes are shown in heatmaps (right panels). e. PCA of DNase-seq libraries from WT or dKO GFP+CD8+ T cells before and after 72-hr ex vivo stimulation with IL-7 and IL-15. f. Differential ChrAcc clusters as determined with DNase-seq, based on the key comparisons in b. Values in parentheses denote site numbers in each cluster. g. Correlation between transcriptomic and ChrAcc changes. Genes in expression clusters (defined in Fig. 2a) were stratified against genes linked to Diff. ChrAcc clusters (f), and the number of overlapping genes was counted. The value of each element in the correlation matrix is the ratio of the observed over expected overlapping gene counts, and all elements are color-coded based on the enrichment values. Color scale in c and d denotes relative gene expression, and that in f denotes relative strength of ChrAcc signals.
