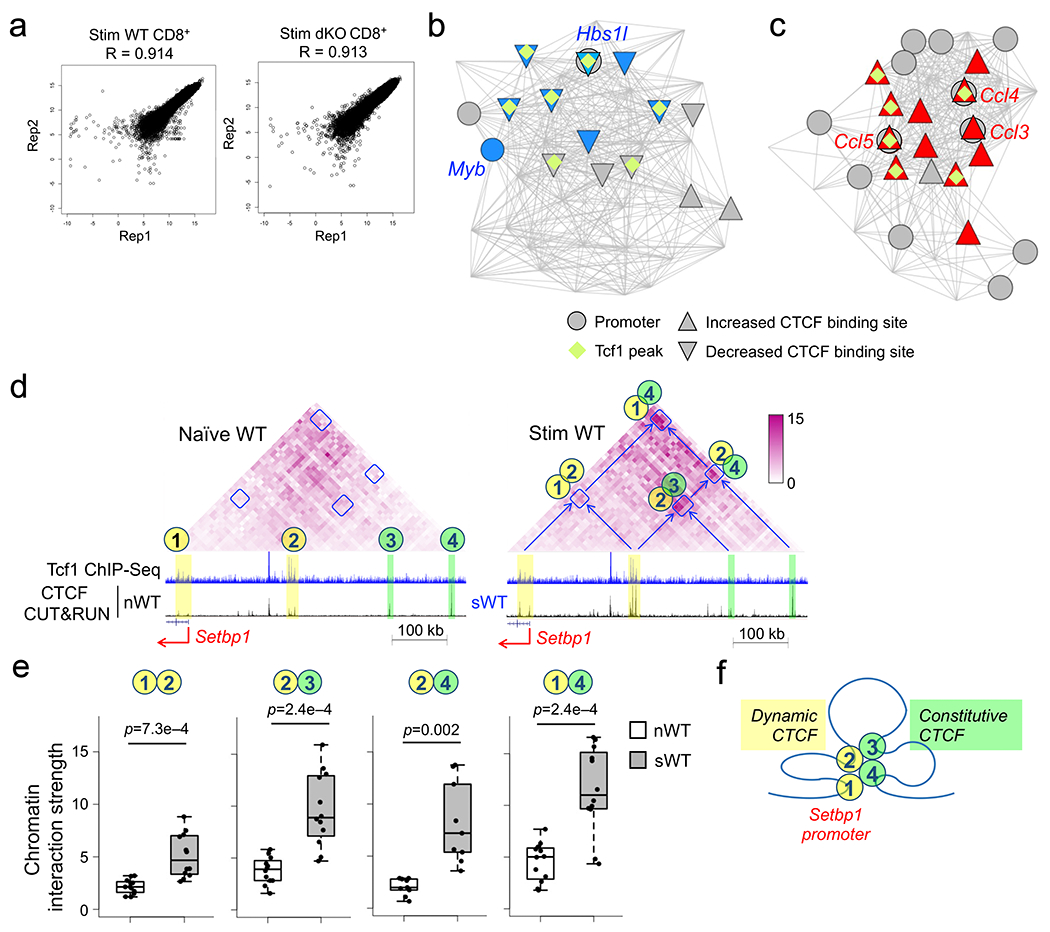
Extended Data Fig. 9. Global analysis of chromatin interaction scores reveals Tcf1-CTCF cooperativity in organizing genomic architecture in CD8+ T cells.

a. Scatterplots showing reproducibility of two biological replicates of Hi-C libraries from WT or dKO CD8+ T cells that were stimulated with IL-7 and IL-15 for 72 hrs ex vivo. The x- and y-axis values for each data point (marked with a dot) represent the interaction scores of an anchor in replicate 1 (Rep1) and replicate 2 (Rep 2), respectively. The R values denote Pearson correlation coefficient. b–c. Visualization of chromatin interaction hubs and connectivity with CTCF binding sites in naïve CD8+ T cells. Comparing chromatin interactions in naïve WT and dKO CD8+ T cells using HiCHub identified cell type-specific interaction hubs. b, WT-specific hub containing the Myb locus, where the nodes represent 10-kb bins and the lines represent chromatin interactions decreased in dKO CD8+ T cells. c, dKO-specific hub containing multiple Ccl genes, where the lines represent chromatin interactions increased in dKO CD8+ T cells. Circles denote bins containing gene promoters (with select gene symbols marked), and diamonds denote the presence of Tcf1 binding peaks. Triangles filled with blue and red denote statistically significant decrease and increase in CTCF binding strength in naïve dKO compared to naïve WT CD8+ T cells, respectively. d–e. IL-7 and IL-15 induce concordant changes in CTCF binding and chromatin interactions in CD8+ T cells. Diamond graphs in d show distance-normalized chromatin interactions in naïve WT (left) and IL-7+IL-15-stimulated (right panel) WT CD8+ T cells at the Setbp1 gene locus. Blue boxes denote chromatin interaction ‘patches’ showing dynamic changes by IL-7+IL-15 stimulation. Shown in the lower panels are gene structure, Tcf1 ChIP-seq tracks in naïve WT, CTCF CUT&RUN tracks in naïve (left) and IL-7+IL-15-stimulated (right panel) WT CD8+ T cells, along with genomic scale. Yellow bars mark dynamic CTCF binding sites, while green bars mark constitutive CTCF binding sites. Both dynamic and constitutive CTCF sites are numbered as chromatin interaction anchors in naïve cells (left), and the interaction ‘patches’ between the numbered anchor regions are annotated in IL-7+IL-15-stimulated cells (right). Color scale denotes chromatin interaction strength. e. Chromatin interaction strength for each pair of 10-kb anchors within each annotated interaction ‘patch’ at the Setbp1 gene locus was determined in naïve and IL-7+IL-15-stimulated WT CD8+ T cells, with p-value calculated using one-sided paired Wilcoxon test. The box center lines denote the median, box edge denotes interquartile range (IQR), and whiskers denote the most extreme data points that are no more than 1.5 × IQR from the edge. f. Projected model of homeostatic cytokine-induced chromatin reorganization that involves both dynamic and constitutive CTCF binding and brings distal regulatory regions into contact with the Setbp1 gene promoter.
