
Extended Data Fig. 10. Characterization of CTCF-deficient CD8+ T cells.
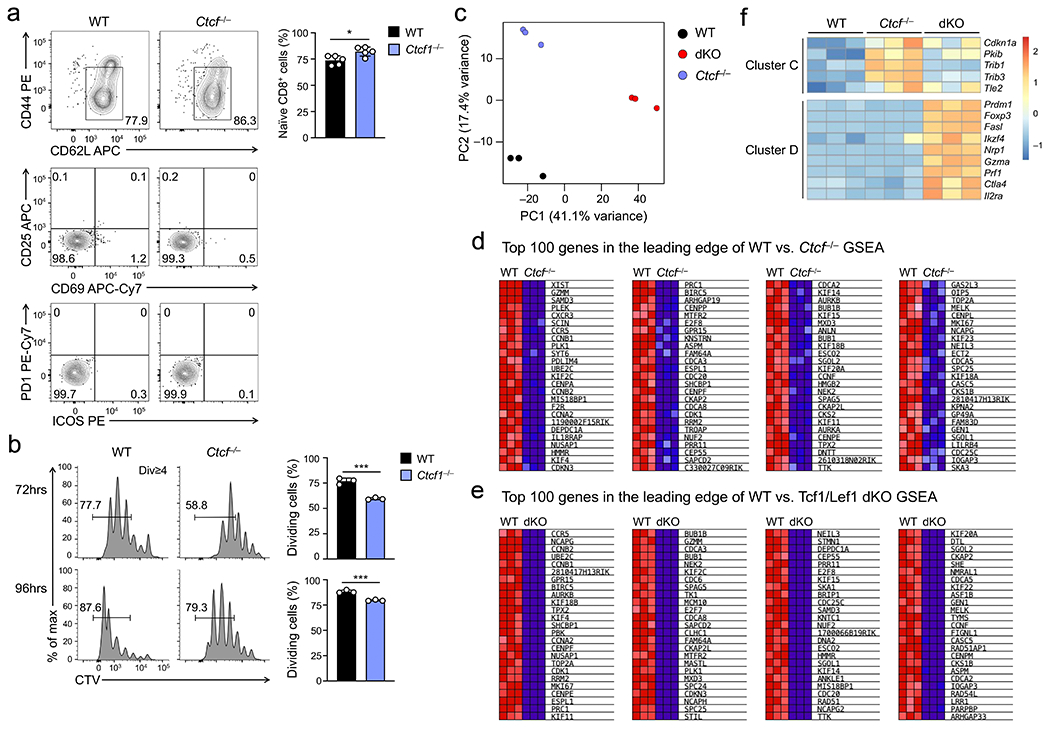
a. Detection of CD44loCD62L+ naïve TCRβ+GFP+CD8+ T cells in splenocytes from WT and Ctcf−/− mice, and further analysis of activation markers including CD25, CD69, PD1, and ICOS of naïve cells. b. Cell division of CTV-labeled naïve WT or Ctcf−/− CD45.2+GFP+CD8+ T cells at 72 (top) or 96 hrs (bottom) after ex vivo stimulation with plate-bound anti-CD3 in the presence of soluble anti-CD28 and IL-2, with frequency of cells showing ≥1 division summarized (right). Representative contour plots (a) and histographs (b) are from 2 experiments, and cumulative data are means ± s.d. *, p<0.05; ***, p<0.001; ns, not statistically significant by two-tailed Student’s t-test. c. PCA of RNA-seq libraries from CTV-labeled WT, dKO and Ctcf−/− GFP+CD8+ T cells sorted at 72 hrs after transfer into Rag1−/− recipients. d–e. Heatmaps showing the top 100 genes in the leading edge from GSEA comparing WT and Ctcf−/− (d) or that comparing WT and dKO CD8+ T cell transcriptomes (e), as in Fig. 8d. Note that among the 616 ExpC1 genes, 337 and 392 genes were in the leading edge of WT vs. Ctcf−/− and WT vs. Tcf1/Lef1 dKO comparisons, respectively. f. Heatmaps of select genes in Clusters C and D as defined in Fig. 8f. Note that dKO but not Ctcf−/− CD8+ T cells showed aberrantly induced expression of TREG cell-associated genes (Foxp3, Nrp1 and Ikzf4) and effector CD8+T cell-associated genes (Prdm1, Fasl and Prf1), consistent with a specific requirement for Tcf1 and Lef1, but not CTCF in providing constant supervision to mature CD8+ T cell identity.