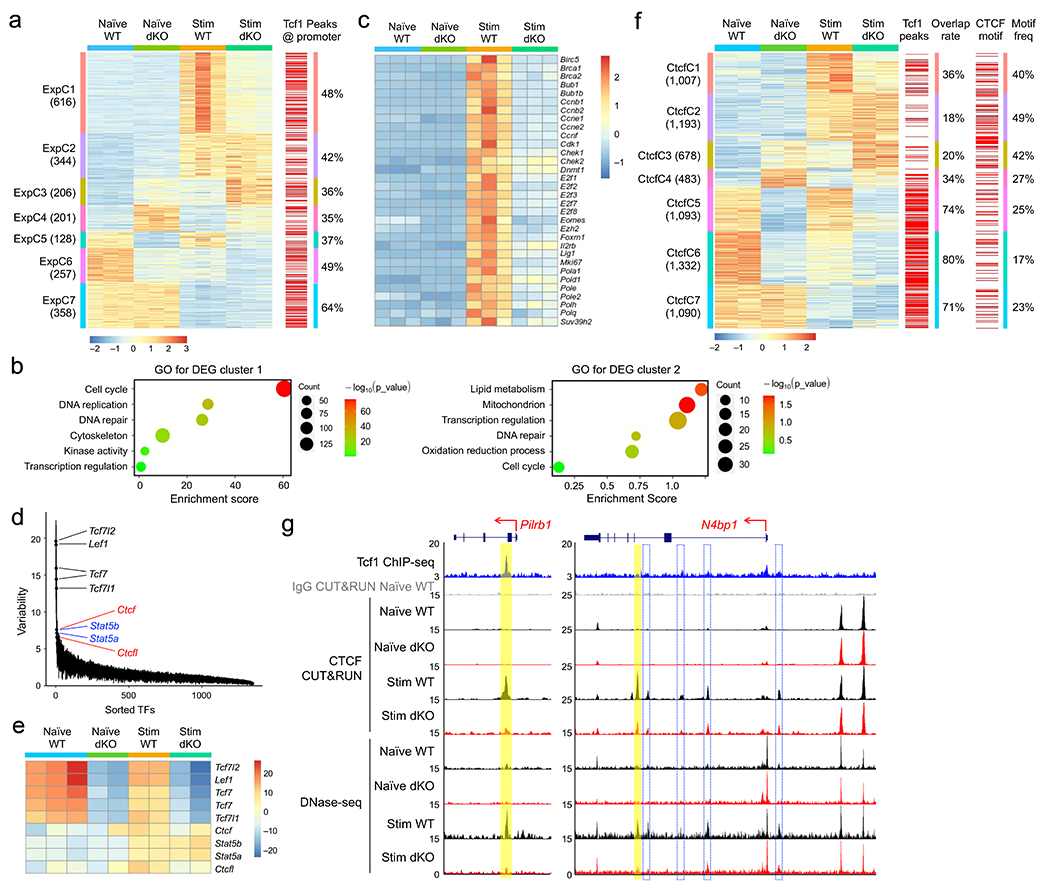
Figure 2. Tcf1 and Lef1 regulate homeostatic cytokine-induced changes in gene expression, chromatin accessibility and CTCF occupancy.

a. Clusters of differentially expressed genes (DEGs) based on RNA-seq analysis of WT or dKO GFP+CD8+ T cells, before and after 72-hr IL-7+IL-15 stimulation, with values in parentheses denoting gene numbers in each cluster and red lines on far right denoting the presence of Tcf1 peaks at corresponding gene promoters. b. Gene ontology (GO) terms for genes in ExpC1 and ExpC2 as determined with the DAVID Bioinformatics Resources, with dot size denoting gene counts and dot color denoting statistical significance. c. Heatmap of select ExpC1 DEGs involved in cell cycle regulation. d. Rank-sorted transcription factors (TFs) plotted against motif variability based on chromVAR analysis of ChrAcc profiles as determined with DNase-seq on WT or dKO GFP+CD8+ T cells before and after IL-7+IL-15 stimulation, with top-ranked TFs marked. e. Heatmap showing ‘accessibility scores’ of top-ranked TF motifs. f. Differential CTCF binding clusters as determined with CUT&RUN on WT or dKO GFP+CD8+ T cells before and after IL-7+IL-15 stimulation, with values in parentheses denoting CTCF peak numbers in each cluster and red lines denoting the presence of Tcf1 peaks (middle) or CTCF motif (right) at corresponding CTCF binding sites. g. Tcf1 ChIP-seq, CTCF CUT&RUN and DNase-seq tracks at the Pilrb1 and N4bp1 gene loci, with gene structure, transcription orientation and genomic scales displayed on top. Vertical bars denote Tcf1+Lef1-dependent, dynamic CTCF binding and ChrAcc sites induced by IL-7+IL-15 stimulation, with yellow bars marking statistically significant differences between WT and dKO CD8+ T cells and open bars with blue borders marking consistent reduction in dKO compared to WT CD8+ T cells but not reaching statistical significance. Color scale in a and c denote z-score-transformed relative gene expression, that in e denotes ‘accessibility scores’ as determined with chromVAR, and that in f denotes z-score-transformed relative CTCF binding strength.
