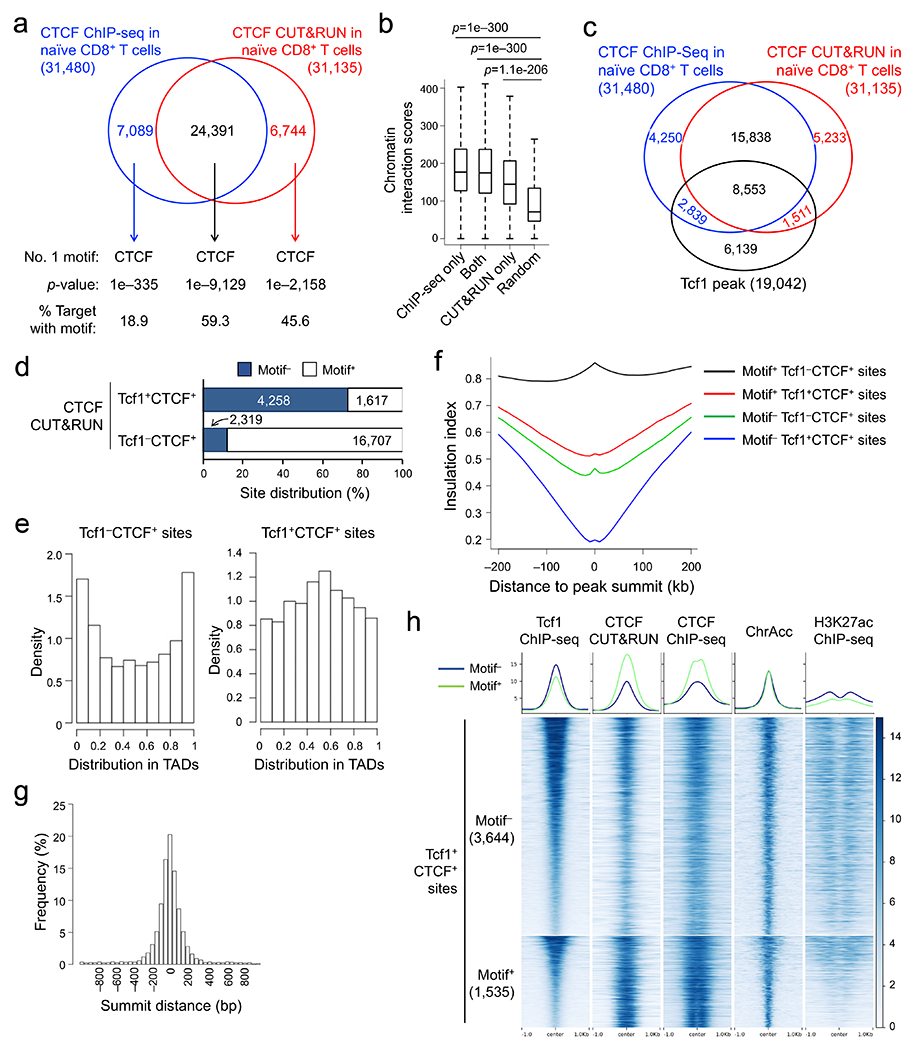
Figure 3. Tcf1 and CTCF exhibit prevalent colocalization in naïve CD8+ T cell genome.

a. Venn diagram showing overlap between ChIP-seq- and CUT&RUN-detected CTCF peaks in naïve WT CD8+ T cells, with the top-ranked motif and characteristics marked for each group as determined with HOMER. b. Box plots summarizing chromatin interaction scores of anchors harboring different groups of CTCF peaks (as defined in a), based on Hi-C data in naïve CD8+ T cells (Ref. 20), with randomly selected 2,000 genomic locations as a negative control and P-values determined with one-sided MWU test. The box center lines denote the median, box edge denotes interquartile range (IQR), and whiskers denote the most extreme data points that are no more than 1.5 × IQR from the edge. c. Venn diagram showing overlap between CTCF and Tcf1 binding peaks in naïve WT CD8+ T cells. d. CTCF motif distribution in Tcf1+CTCF+ and Tcf1−CTCF+ in distal regulatory regions (as determined with CUT&RUN using the motifmatchr package in R), with values in bars denoting actual numbers of sites with or without the motif. e. Positional distribution of Tcf1−CTCF+ (left) and Tcf1+CTCF+ (right) sites within TADs, where CTCF binding sites were determined with CUT&RUN. f. Profiles of insulation index around the four types of CTCF binding sites where Motif+ denotes the presence of CTCF motif (as determined with CUT&RUN). g. Distribution of summit distance (in 50 bp resolution) between Tcf1 and CTCF peaks at Tcf1+CTCF+ sites (detected by both CUT&RUN and ChIP-seq methods). h. Heatmaps showing local chromatin characteristics (including Tcf1 and CTCF binding peaks, ChrAcc and H3K27ac) of Motif− and Motif+ Tcf1+CTCF+ sites in distal regulatory regions (detected by both CUT&RUN and ChIP-seq methods), with aggregated profiles for each feature shown on the top. Color scale denotes relative strength of each molecular feature.
