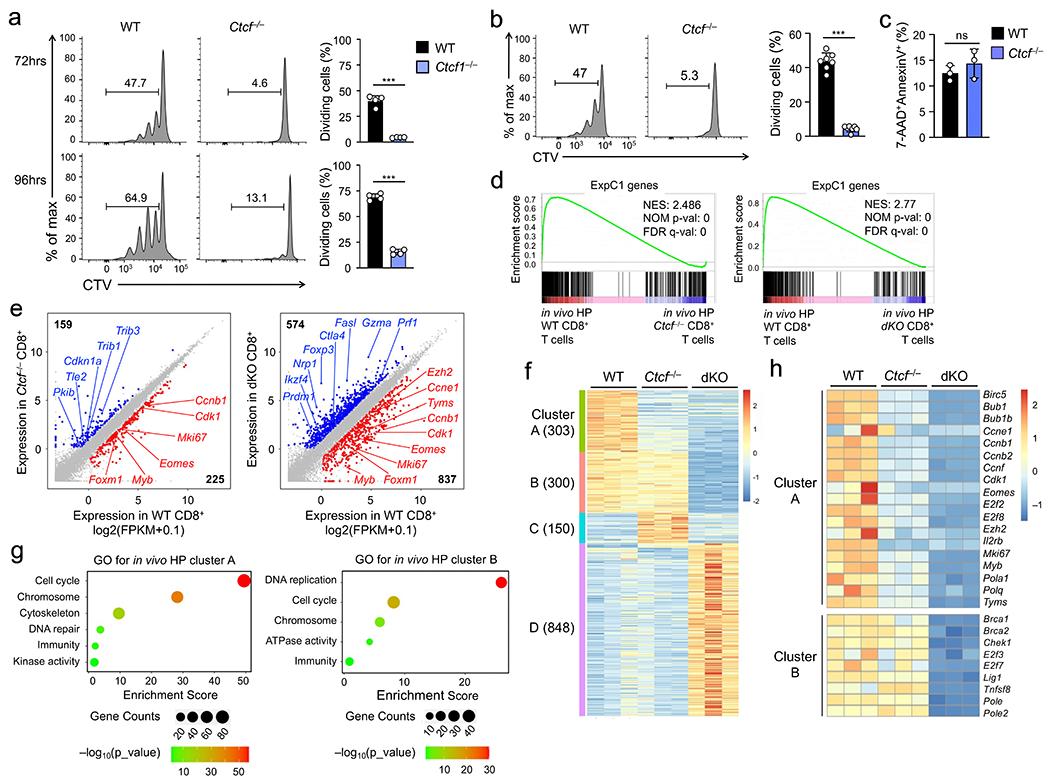
Figure 8. CTCF regulates homeostatic proliferation of CD8+ T cells by controlling a similar set of target genes as Tcf1 and Lef1.

a. Cell division of CTV-labeled naïve WT or Ctcf−/− CD45.2+GFP+CD8+ T cells at 72 (top) or 96 hrs (bottom) after ex vivo culture with IL-7 and IL-15, with frequency of cells showing ≥1 division summarized (right). b. Cell division of CTV-labeled WT and Ctcf−/− CD45.2+GFP+CD8+ T cells at 72 hrs after separate transfer into Rag1−/− mice, with frequency of cells showing ≥1 division summarized (right). c. Detection of AnnexinV+7-AAD− apoptotic cells in WT and Ctcf−/− CD45.2+GFP+CD8+ T cells at 72 hrs after separate transfer into Rag1−/− mice. Data in a–c are from 2 independent experiments, and bar graphs are means ± s.d. ***, p<0.001; ns, not statistically significant by two-tailed Student’s t-test. d. GSEA enrichment plots for the ExpC1 gene set (defined in Fig. 2a) in comparison of WT vs. Ctcf−/− (left) and WT vs. dKO CD8+ T cell transcriptomes (right), as determined with RNA-seq analysis of WT, Ctcf−/−, dKO CD8+ T cells that underwent in vivo homeostatic proliferation (HP) in Rag1−/− hosts for 72 hrs. NES, normalized enrichment score; NOM p-val, nominal P values; FDR q-val, false discovery rate q values. e. Scatter plots showing DEGs between WT and Ctcf−/− (left) and those between WT and dKO CD8+ T cells (right), with values in corners denoting DEG numbers and select genes marked. f. Clusters of DEGs as defined in e, with values in parentheses denoting gene numbers in each cluster. g. GO terms of genes in Clusters A and B as determined with the DAVID Bioinformatics Resources, with dot size denoting gene counts and dot color denoting statistical significance. h. Heatmap showing the expression of select genes in cell cycle regulation from Clusters A and B. Color scale (g, h) denotes relative gene expression.
