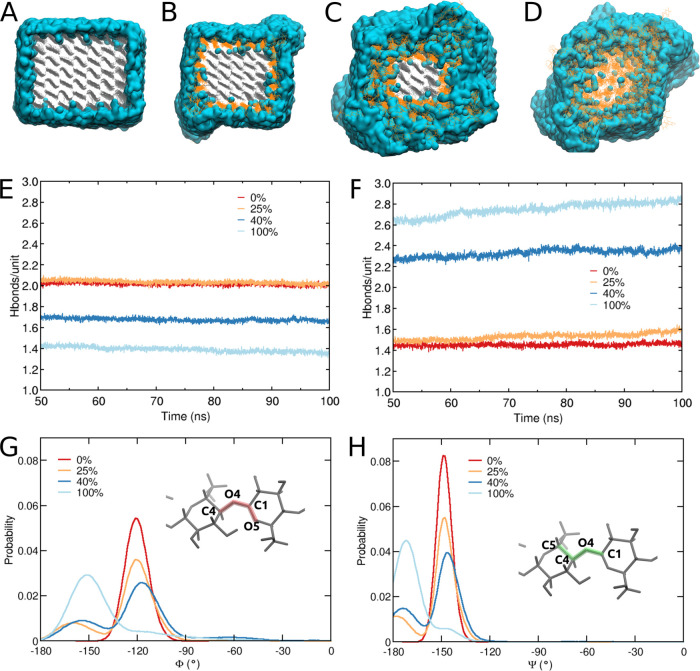
Figure 3.
Distribution of water molecules around CNCs (A–D) for degree of modifications of (A) 0%, (B) 25%, (C) 40%, and (D) 100%. The water molecules within 6 Å of cellulose are only shown. Gray color depicts the unmodified cellulose chains and orange color the dialcohol-modified chains; water is depicted in blue. Number of hydrogen bonds per glucose unit as a function of simulation time, for (E) within the CNC (cellulose/cellulose chains) and (F) between a CNC and surrounding water molecules (CNC/water); probability distributions of the torsion angles (G) Φ and (H) Ψ, describing the conformation around the glucosidic bonds.

