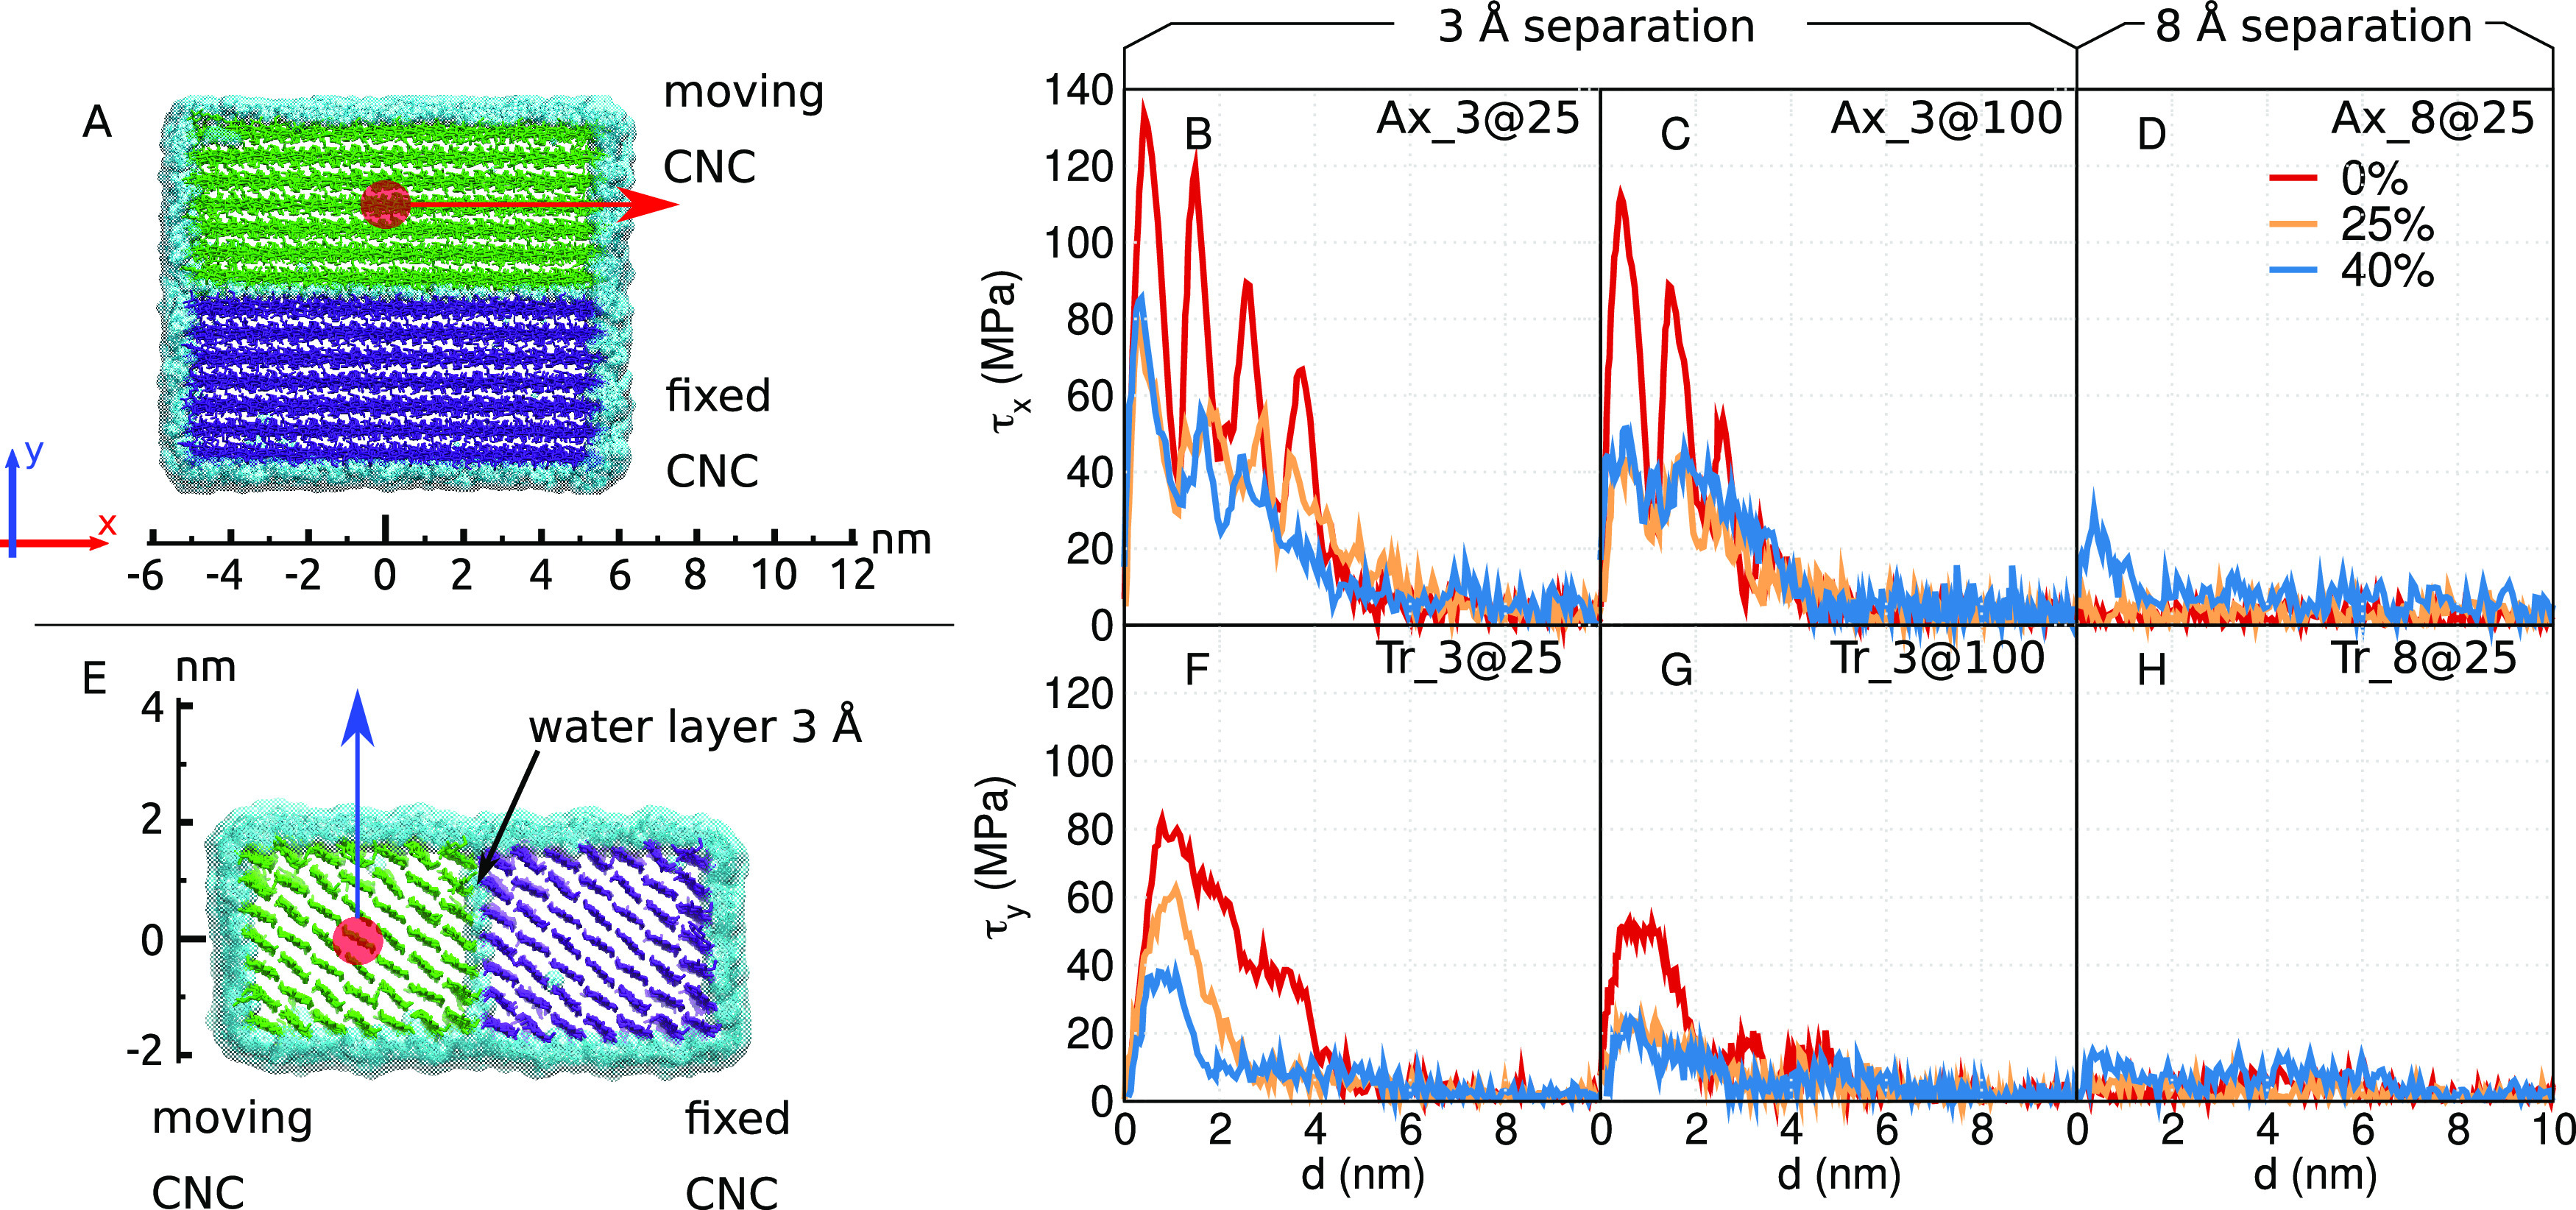
Figure 5.

Schematic representation of the (A) axial (Ax) and (E) transverse (Tr) shear simulations, and stress–displacement curves for CNCs of different degrees of modification and system conditions (water layer and temperature) (B) Ax_3@25; (C) Ax_3@100; (D) Ax_8@25; (F) Tr_3@25; (G) Tr_3@100; (H) Tr_8@25.
