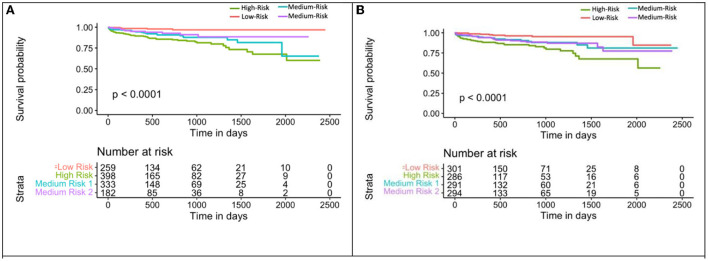
Figure 7.
Kaplan-Meier plot for MACE-free survival according to eRiS+CAC and eRiS only risk groups in Sv (4). (A) The eRiS+CAC threshold showed worse prognosis for patients with high eRiS combined with high CAC score. HR between high and low risk: 6.72 [4.42–10.22]. (B) Similar observation seen in eRiS based segregation. HR between high and low risk: 5.22 [2.54–10.75].

