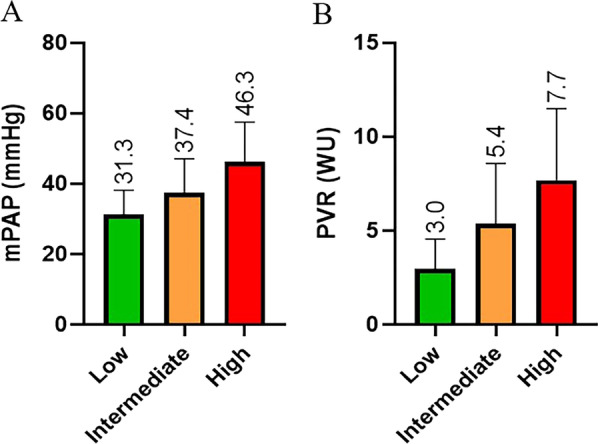
Fig. 5.

a Comparison of mPAP (mmHg) relative to TTE probability of PH. Kruskal–Wallis analysis demonstrated mPAP values were significantly different across TTE PH probability groups; Kruskal–Wallis H = 138.2 (2) (P < 0.0001). Pairwise analysis with adjusted P-values demonstrated mPAP was significantly higher in those with either high or intermediate TTE probability compared to low (both P < 0.0001). mPAP was also significantly higher in those with intermediate compared to low TTE probability (P < 0.0001). mPAP (mean pulmonary artery pressure). b Comparison of PVR (woods units) relative to TTE probability of PH. Kruskal–Wallis analysis demonstrated PVR was significantly different across TTE PH probability groups; H = 138.3(2) (P < 0.0001). Pairwise analysis with adjusted P-values demonstrated PVR was significantly higher in those with high or intermediate TTE probability compared to low probability (both P < 0.0001). PVR was also significantly elevated in those with intermediate compared to low TTE probability (P < 0.0001). PVR (pulmonary vascular resistance)
