Fig. 5.
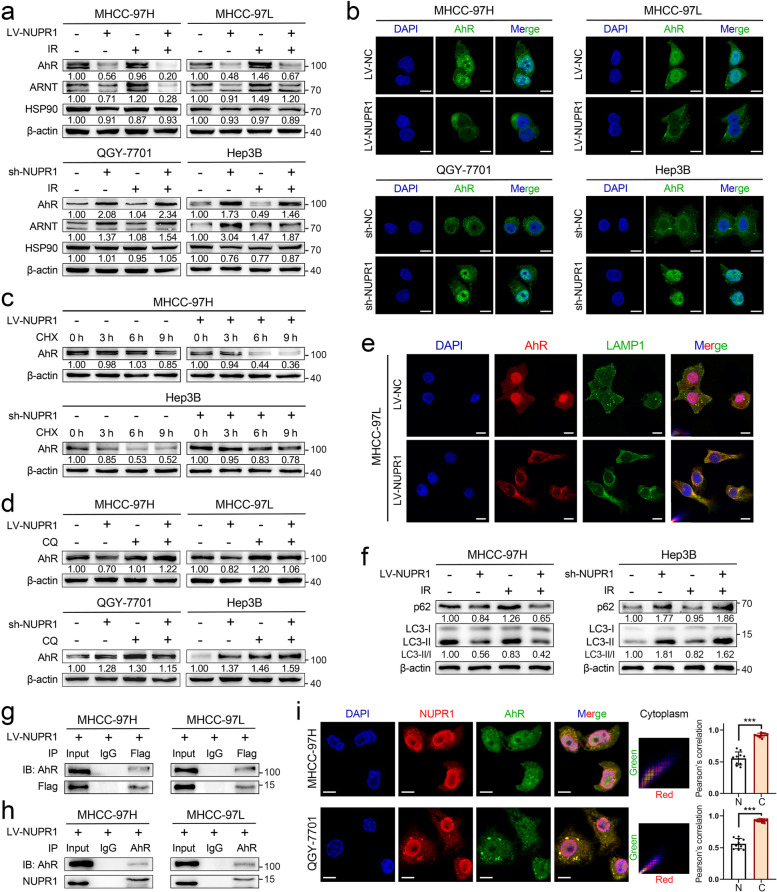
NUPR1 binds to AhR and promotes degradation of AhR in the autophagy-lysosome pathway. a Western blot was used to examine the protein levels of AhR, ARNT, and HSP90 in NUPR1-overexpressing MHCC-97H/MHCC-97L cells and NUPR1-knockdown QGY-7701/Hep3B cells with or without IR (8 Gy). b Immunofluorescence staining was performed to determine the location of AhR (green) in the indicated cell lines. The nuclei were counterstained with DAPI (blue). Scale bar: 10 μm. c Western blot was used to detect AhR levels in indicated cell lysates collected at different timing (0, 3, 6, 9 h) after 20 μg/mL CHX treatment. d Western blot of AhR protein was performed in cell lysates from different NUPR1 expression status cell lines with or without 20 μM CQ treatment. e Representative immunofluorescence images show the distribution of AhR (red), LAMP1 (green), and DAPI (blue) in LV-NC and LV-NUPR1 MHCC-97L cells. Scale bar: 10 μm. f The levels of LC3-II and p62 in cells with a different NUPR1 expression were determined by western blot. g The anti-Flag and anti-IgG products after incubating with lysates from MHCC-97H/MHCC-97L ectopically expressed Flag-tagged NUPR1 were used to detect Flag-NUPR1 and AhR protein by western blot. h Western blot analysis of NUPR1 and AhR in anti-AhR and anti-IgG products was performed. Cell lysates were immunoprecipitated with antibodies against AhR or IgG. i Representative immunofluorescence images of QGY-7701/MHCC-97H cells show the staining of NUPR1 (red), AhR (green), and nuclei counterstained with DAPI (blue) (left). Scale bar: 10 μm. Pearson correlation of the signal intensity of indicated molecules in different subcellular locations was quantified by ImageJ software (N/nucleus, C/cytoplasm, right)

