Figure 3.
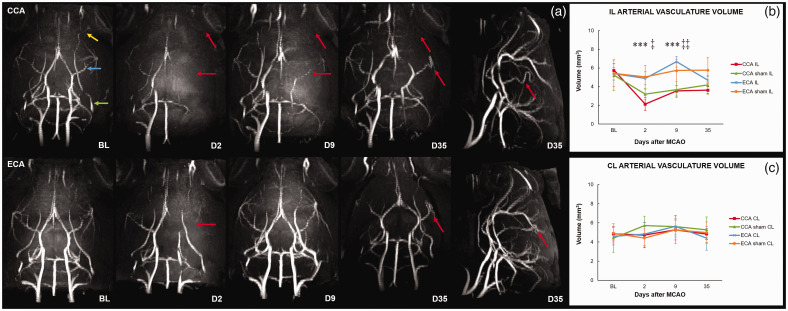
High-resolution MR angiography defines the Koizumi (CCA) middle cerebral artery occlusion method as a model of ischemia with chronic hypoperfusion. Maximum intensity projections (MIP) of MR angiography scans (a) and measured ipsilateral (b) and contralateral (c) arterial vasculature volume before and after middle cerebral artery occlusion (MCAO) by filament insertion through the common carotid artery (CCA; a-upper row) or external carotid artery (ECA; a-bottom row) show animals at baseline (BL) and on days 2 (D2), 9 (D9), and 35 (D35) after MCAO. Pre-surgery (BL) angiograms: yellow arrow – ophthalmic artery (OA); blue arrow – middle cerebral artery (MCA); green arrow – pterygopalatine artery (PPA). On D2, the MIP show hypoperfusion of the ipsilateral (IL) hemisphere in the CCA group. On D9, the attenuation of blood flow persists in the IL internal carotid artery (ICA), distal portion of the MCA, PPA, OA, and the segment between the anterior cerebral artery (ACA) and MCA, with prominent hyperperfusion of the contralateral (CL) ICA and the segments between the posterior cerebral artery (PCA) and MCA, and MCA and ACA. On D35, undetectable signal intensity of the IL PPA, OA, and ICA, with increased signal intensity of the CL ICA and the CL part of the circle of Willis. Tortuosity of the IL MCA (lateral view of CCA D35). On D2, the ECA-MCAO group shows lower signal intensity of the IL MCA with hypoperfused segment between the IL ACA and MCA, and no changes in the PPA or OA. On D9, the perfusion of the IL hemisphere is reestablished and slightly hyperperfused. On D35, the perfusion in the ECA-MCAO group shows baseline levels. Looping and kinking of the distal portion of the IL MCA (lateral view of ECA D35). Red arrows represent hypoperfused arteries or arterial tortuosity and path alteration. Statistical differences using mixed model ANOVA and Tukey post hoc test for the CCA to ECA group (***) P < 0.001; CCA sham to ECA sham group (‡) P < 0.05 (‡‡) P < 0.01. Error bars represent standard deviation.

