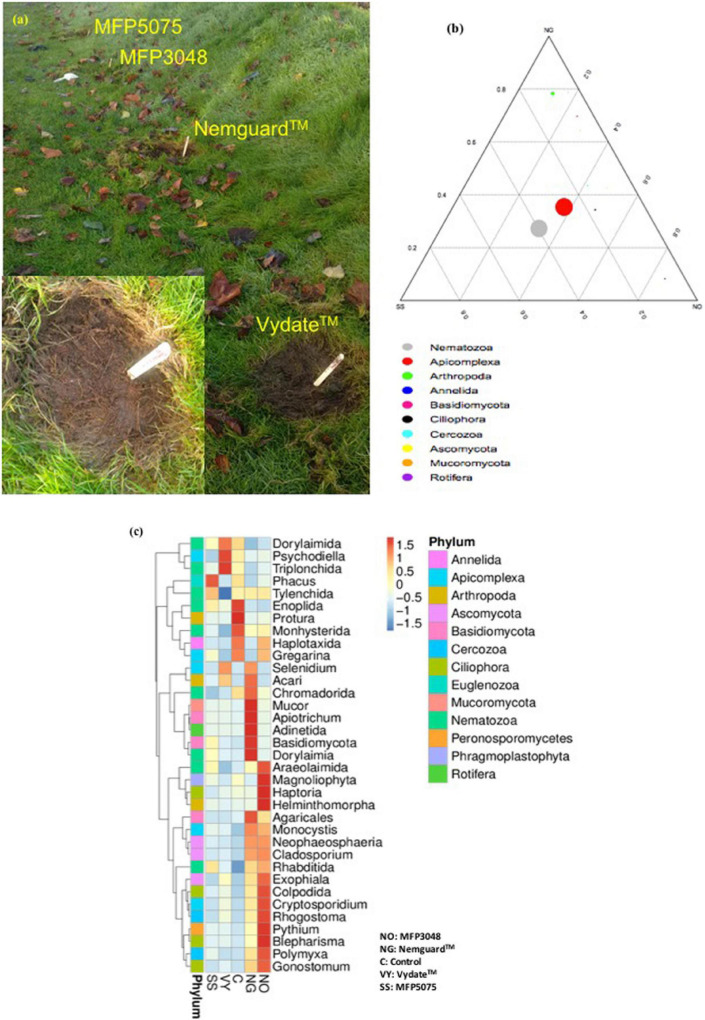
FIGURE 1.
(a) Garden patches showing treatments with different products; (b) Ternary plot; (c) Heatmaps representing the abundances of the top nine nematode orders in treatment groups. The Z-score ranges between 1.5 and –1.5 and represents the distance between the raw score and the mean of the standard deviation. “Z” is negative when the raw score is below the mean, and vice versa.

