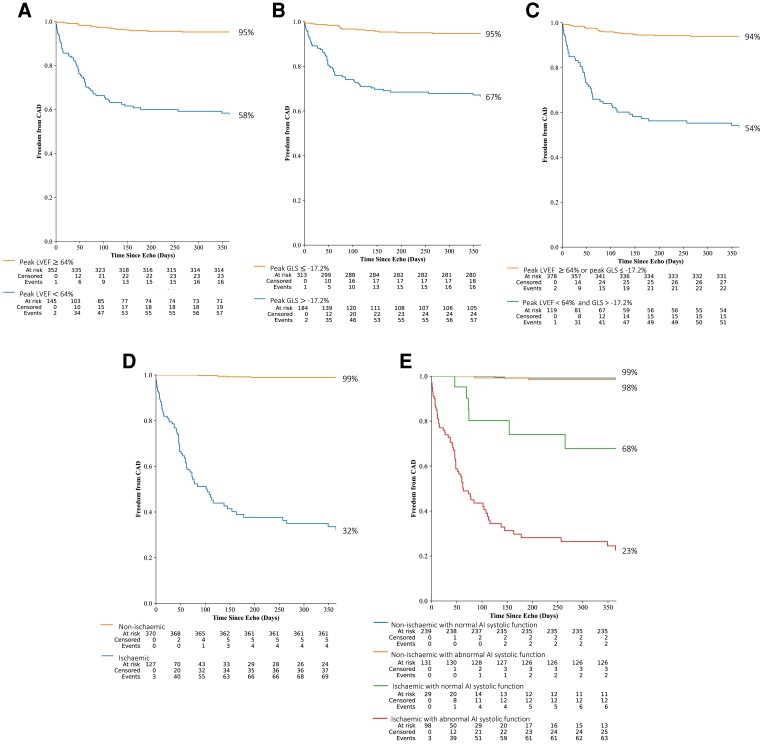
Figure 4.
Kaplan–Meier cumulative event curves for freedom from significant coronary artery disease stratified according to artificial intelligence-calculated systolic function and/or the presence of inducible ischaemia over 12 months. (A) Artificial intelligence-calculated peak left ventricular ejection fraction. (B) Artificial intelligence-calculated peak global longitudinal strain. (C) Both artificial intelligence-calculated peak left ventricular ejection fraction and peak global longitudinal strain. (D) Ischaemia. (E) Ischaemia and both artificial intelligence-calculated peak left ventricular ejection fraction and peak global longitudinal strain; for brevity, normal artificial intelligence systolic function refers to peak left ventricular ejection fraction ≥64% or peak global longitudinal strain ≤17.2%, and abnormal artificial intelligence systolic function refers to both peak left ventricular ejection fraction <64% and peak global longitudinal strain >17.2%. Tables are shown below the graphs of participants at risk, censored and those who have had events for every 50 days, with the figures to the side of every event curve indicating the percentages after 12 months, with confidence intervals shown in Supplementary material online, Table S4.

