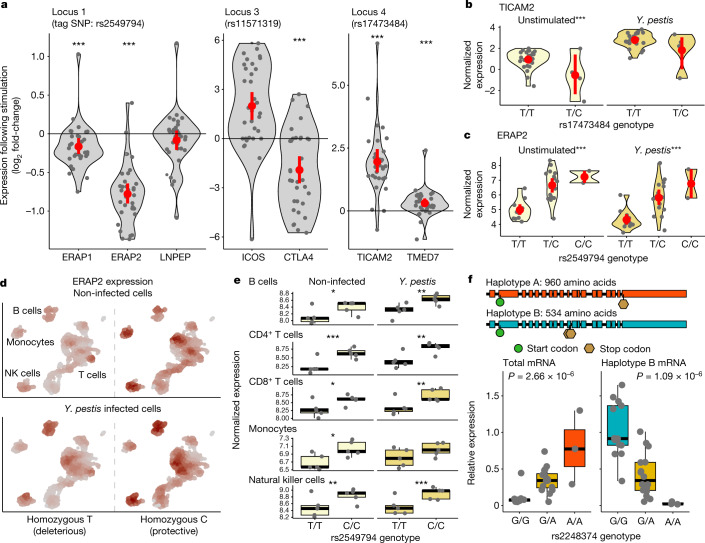
Fig. 3. Positively selected loci are associated with changes in gene regulation upon Y. pestis stimulation.
a, Normalized log2 fold-change of genes within 100 kb of candidate variants in response to incubation of primary macrophages for four hours with heat-killed Y. pestis. Dark grey dots correspond to the fold-change observed for each of the 33 individuals tested; red dots and bars represent the mean ± standard deviation. With the exception of LNPEP, all associations are significant (10% false discovery rate). b,c, Effect of rs1747384 genotype upon TICAM2 expression (b) and rs2549794 genotype upon ERAP2 expression (c), split by macrophages stimulated for four hours with heat-killed Y. pestis and unstimulated macrophages. Red dots and bars represent the mean ± standard deviation. d, Comparison of ERAP2 expression among non-infected and infected cells with live Y. pestis for five hours, profiled using scRNA-sequencing data in individuals with homozygous rs2549794 genotypes. Colour intensity reflects the level of ERAP2 expression, standardized for unstimulated or infected cells. Major PBMC cell types are labelled and can be found clearly coloured in Extended Data Fig. 7; CD4+ and CD8+ T cells were analysed separately. NK, natural killer. e, Effects of rs2549794 genotype upon ERAP2 expression, split by infected and non-infected conditions, for each cell type. f, Illustration of the two haplotype-specific ERAP2 spliced forms for Haplotype A and Haplotype B with start (green) and stop (brown) codons. Below we show the effect of rs2248374 genotype upon total mRNA expression of ERAP2 (left) and the specific expression of the isoform (Haplotype B) encoding the truncated version of ERAP2 (right). For all panels: ***P < 0.001; **P < 0.01; *P < 0.05.

