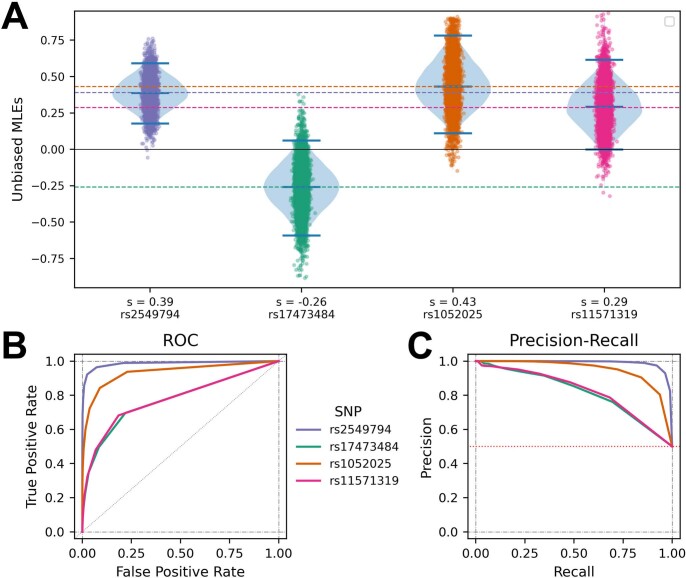
Extended Data Fig. 2. Estimates of the selection coefficients for the four SNPs of interest and power of the inference procedure.
(A) Distributions of for the four SNPs when replicates are simulated with the corresponding bootstrapped allele frequency distributions as initial conditions and bootstrap-corrected estimates . Whiskers on the violin plots label the 2.5-, 50-, and 97.5-percentiles of their respective distributions. (B) ROC and (C) Precision-Recall curves for the estimation procedure to distinguish replicates under selection from those under neutrality.

