. 2022 Oct 19;12(46):29908–29914. doi: 10.1039/d2ra05324a

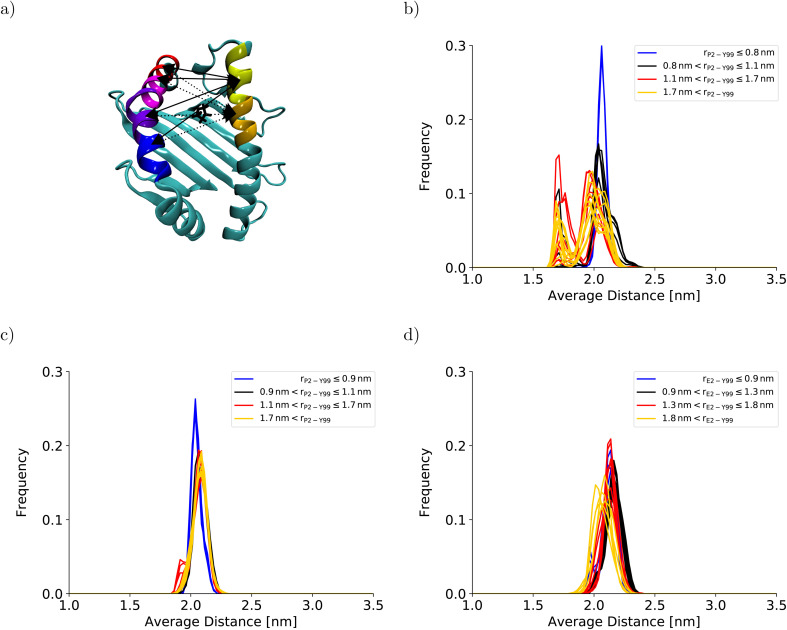
Fig. 3. Binding groove plasticity as captured by sextet distances. To judge the groove's plasticity, eight pair distances between the centers of mass of the Cα-atoms of sextets of residues on opposite binding groove helices were calculated. These sextet distances were computed for residues 59–64 (yellow) and 65–70 (orange) on the α1-helix and residues 152–157 (blue), 158–163 (violet), 164–169 (magenta), and 170–175 (red) on the α2-helix, which are highlighted on the HLA-B*35:01 binding groove in (a). The four sextet distances including the first segment on the α1-helix are shown as solid lines; the four sextet distances including the second segment on the α1-helix are depicted as dotted lines. The arrows point to the correct segment; they do not indicate the exact position of the center of mass. The black licorice model illustrates the position of P2 at the peptide N-terminus. The positions of the corresponding residue sextets in the HLA-B*44:02 binding groove are highlighted in Fig. S3 in the ESI. The distribution of the average of these eight sextet distances is shown for (b) HLA-B*35:01 (starting from the final structures of the BEUS simulation with AMBER99SB*-ILDNP28), (c) HLA-B*35:01 (starting from the crystal structure), and (d) HLA-B*44:02 (starting from the crystal structure). Histograms shown in blue represent umbrella windows of the fully bound state, histograms in black belong to the barrier region of the PMF, and histograms in red and yellow belong to the adjacent and distant half of the partially dissociated state, respectively. The histograms of the individual distances are shown in Fig. S4–S11 in the ESI..

Fig. 3