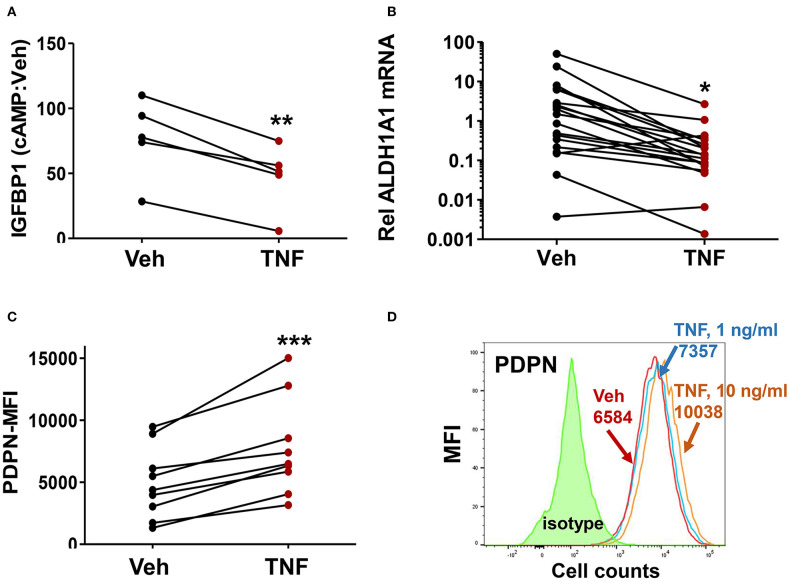
Figure 3.
Treatment of control ME-SFCs with TNF induces an endometriosis-like phenotype. (A) Inhibition of IGFBP1 by TNF. Healthy control ME-SFCs (n = 5) were treated with vehicle (Veh) and TNF (10 ng/ml) in separate flasks on days 1 and 3. On day 7 ME-SFCs were lifted, washed and plated in decidualization media. Decidualization capacity was analyzed after treating the vehicle- and TNF-treated cells with vehicle and cAMP (0.5 mM), as described in Figure 1A. After 24 h culture supernatants were analyzed for IGFBP1 concentrations by ELISA. Decidualization capacity (the ratio of cAMP-IGFBP1:vehicle-IGFBP1) for each subject under both conditions was determined as in Figure 1A. (B) Inhibition of ALDH1A1 mRNA expression by TNF. Healthy control ME-SFCs (n = 19) were treated with vehicle (Veh) and TNF (10 ng/ml), in separate flasks, on days 1 and 3. On day 7 cells were lifted, washed and plated in decidualization media for 24 h and then analyzed for ALDH1A1 mRNA expression by real time qPCR as in Figure 2A. Relative differences in ALDH1A1 gene expression for each pair of cells (for each subject under both conditions, vehicle-treated and TNF-treated) were normalized to expression levels of a housekeeping gene, HPRT1. (C) Enhanced PDPN surface expression by TNF. Healthy control ME-SFCs (n = 9) were treated with vehicle (Veh) and TNF (10 ng/ml) for 48 h in separate flasks, and then analyzed for PDPN surface expression by flow cytometry. Data are shown as MFI (corrected for isotype control) for each subject under both conditions (vehicle-treated and TNF-treated). For (A–C), paired data points (after vehicle treatment and TNF treatment) are shown for the cells from each subject. (A–C) Significance was determined using paired students t-test. *P < 0.05; **P < 0.01; ***P < 0.001. (D) Representative histograms of PDPN surface expression after exposure of control ME-SFCs to vehicle and TNF. Healthy control ME-SFCs were treated with vehicle and TNF (1 ng/ml or 10 ng/ml) in separate flasks for 48 h, and then analyzed for PDPN surface expression by flow cytometry. The histogram plot for isotype control, PDPN-vehicle, PDPN-TNF (1 ng/ml), and PDPN-TNF (10 ng/ml) with each mean MFI is shown.

