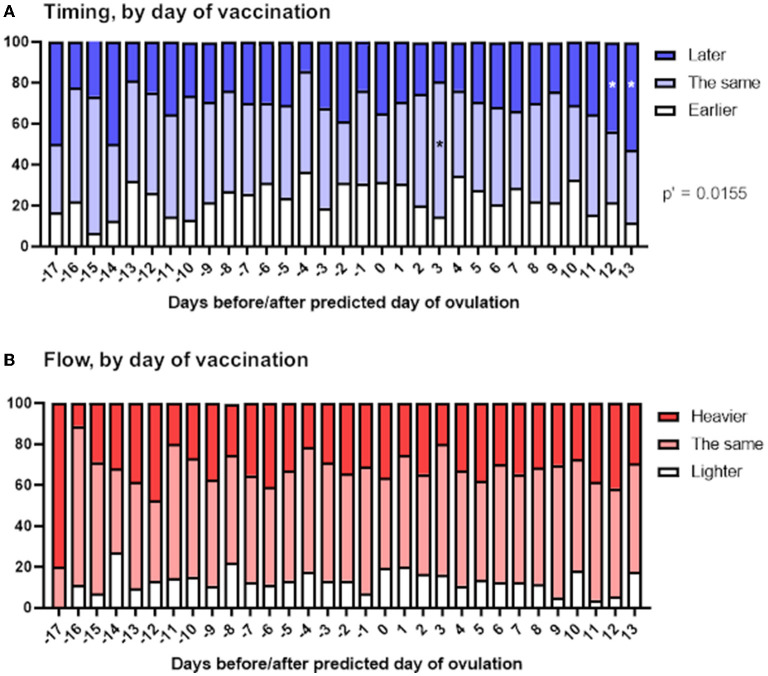
Figure 4.
Associations between menstrual changes and timing of vaccination within the menstrual cycle. The proportional area charts depict the proportion of respondents who reported a change to the timing (A) or flow (B) of the period following vaccination, stratified by day of the menstrual cycle on which the vaccine was given, relative to the predicted day of ovulation. Statistical testing with a Chi squared test with Holm-Bonferroni sequential correction for multiple hypothesis testing. Adjusted p-values are shown; * denotes categories in which the standardized residual is greater than the critical value (1.96).

