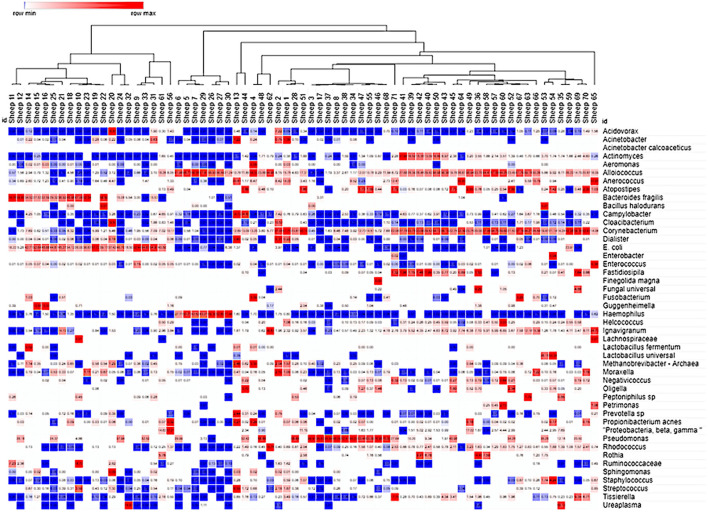
Figure 4.
Cluster analysis of the ovine VMB in naïve and Sham-treated animal samples. Heat map clustering [unsupervised using Morpheus online (43)] illustrated dominance by individual or combinations of bacteria as well as grouping of samples into community type (CT) categories indicated by branching shown across the top of the Figure. Proportional levels of the bacteria (right vertical labels) quantified by the VMBA are shown in rows with each sample (n = 71 distinct sheep) shown as a distinct column. Red boxes represent the maximal levels detected in a row, and blue shows the lowest detection levels. Clustering helped to identify CTs that were dominated by biomarker organisms that were confirmed by statistical comparisons, leading to the categorical CT system shown in Figure 5.

