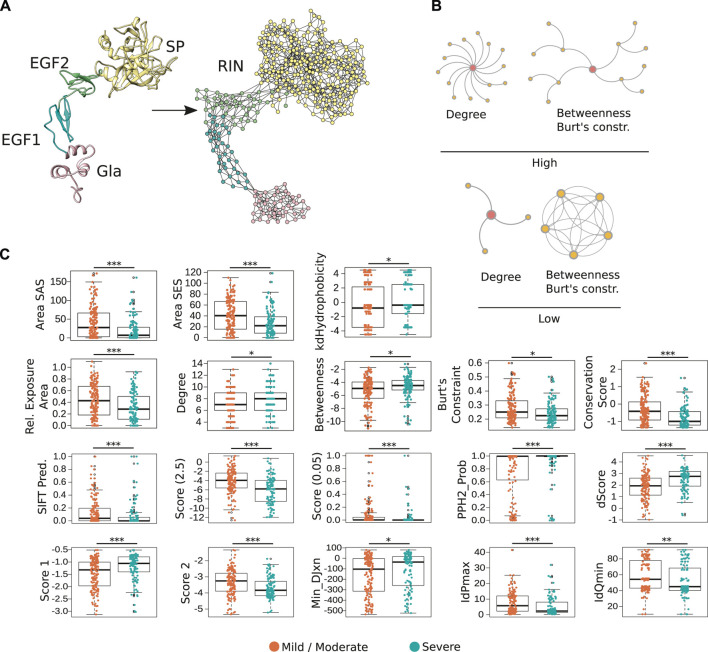
FIGURE 1.
Representation of FIXa structure as a residue network. (A) In the FIXa RIN, each node represents an amino acid, and two nodes are connected by an edge if their atoms are in close proximity (∼5 Å). (B) The degree quantifies the number of connections a residue has, the betweenness indicates how many times a node served as a bridge on the shortest path along two other amino acids, and the Burt’s constraint was derived from social science studies to quantify the position of advantage of individuals within an organization (Burt, 2009). Nodes with high-degree participate in multiple molecular interactions, and those with high-betweenness and low Burt’s constraint serve as intermediate between different groups of amino acids. In contrast, residues with low degree, low betweenness and high Burt’s constraint usually do not have many connections to other residues and are located at the periphery of the network. (C) Properties derived from the FIXa structure or from the RIN are good indicators of the severity of HB. Depicted is the solvent-accessible (areaSAS) and the solvent-excluded (areaSES) surface areas, the relative exposure of amino acids (Rel. Exposure Area), the conservation of the FIXa residues (smaller values indicate higher conservation), and the RIN centrality measures. Also depicted are measures derived from SIFT (Sim et al., 2012), Provean (2 Scores, −2.5 and 0.05) (Choi and Chan, 2015), and from Polyphen-2 (PPH2-Prob, dScore, Score 1, Score 2, MinDJxn, IdPmax, IdQmin) (Adzhubei et al., 2010). The boxplots show the median (center line), the first and third quartiles (lower- and upper-bounds), and 1.5 times the inter-quartile range (lower- and upper whiskers). Each dot in the plot is an amino acid mutation (i.e., a clinical case report). Unpaired, two-sided Wilcoxon test (***p-values < 0.001; **p-value < 0.01; *p-value < 0.05).

