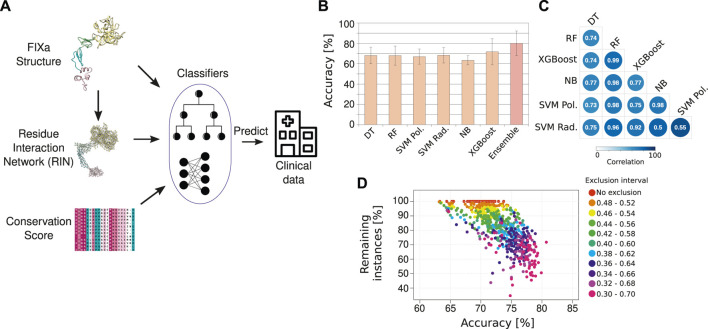
FIGURE 3.
The HemB-Class machine learning framework. (A) Our machine learning classifiers received as input the properties from the FIXa structure, from the FIXa RIN, the conservation score of each amino acid and measures derived from other variant prediction algorithms [SIFT (Sim et al., 2012), Provean (Choi and Chan, 2015), and Polyphen-2 (Adzhubei et al., 2010)]. The output of our classifiers is the severity of HB, derived from clinical reports from the EAHAD FIX mutation database (Rallapalli et al., 2013). (B) Comparative performance of six classifiers and a combination of the best classifiers (Ensemble—we named it HemB-Class). The bars depict the mean values of 10 repetitions of 10-fold cross validations and the error bars are the standard deviation values. (C) Spearman correlation of the predicted probabilities outputted by the classifiers. (D) The trade-off between the number of instances classified and the accuracy. Each dot is the classification performance of an individual classifiers or the ensembles when we vary the classification threshold to create an “exclusion area” to disregard instances with ambiguous classifications.

