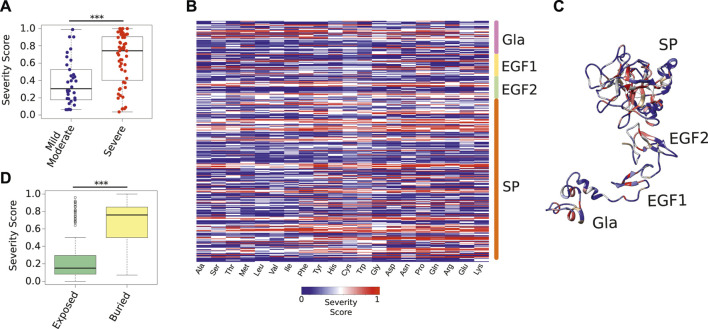
FIGURE 4.
Severity Score of all possible FIXa mutations. (A) The Severity Score of mutations not used during the training phase because they had conflicting symptoms reported in the medical literature. Our predictions agreed with the majority class of each mutation (Supplementary Table S5). (B) The Severity Score predicted by the HemB-Class framework for the mutations of each FIXa residue to the 19 remaining amino acids. (C) The location of the residues with the highest Severity Scores. These residues, located at the core of each FIXa domain, are unlikely to accept any amino substitution (Supplementary Table S6). (D) The most buried residues (less than 25% relative surface exposure), have significantly higher Severity Scores than the most exposed residues. The boxplots show the median (center line), the first and third quartiles (lower- and upper-bounds), and 1.5 times the inter-quartile range (lower- and upper whiskers). Each dot in the plot is an amino acid mutation (i.e., a clinical case report). Unpaired, two-sided Wilcoxon test (***p-values < 0.001; **p-value < 0.01; *p-value < 0.05).

