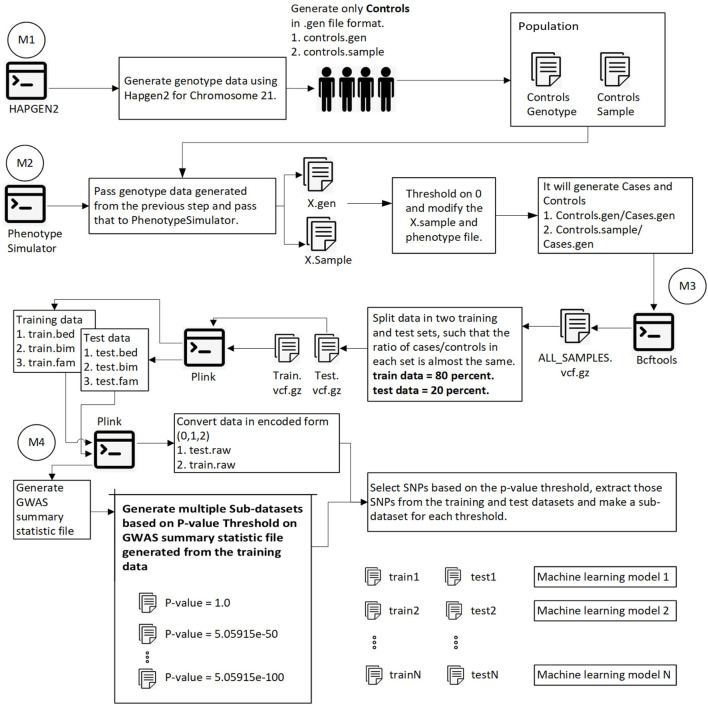
FIGURE 1.
This diagram shows the overall process of generating data, splitting data into training and test sets, calculating the p-value for each SNP, and generating sub-datasets based on p-value thresholding. Module 1: Pass 1000 Genome and hapmap3 datasets (Chromosome 21) to hapgen2 and generate 10,000 controls (gen and controls.sample files). Module 2: Pass previously generated data to PhenotypeSimulator, which produces each person’s phenotype. Convert continuous phenotype to binary phenotype (cases/controls) by thresholding at 0. Module 3: Merge all cases/controls and convert the data in. vcf.gz file format. Split the data into training (80%) and test data (20%) such that the ratio of cases/controls in each set is the same. Using plink convert train.vcf.gz and test. vcf.gz to plink file format (.bed,.bim,.fam). Module 4: Using plink, generate a GWAS summary statistic file that contains the p-value for each SNP. Extract SNPs based on p-value threshold from training and test set and recode the genetic information (aa = 0, aA//Aa = 1, AA = 2). We have the training and test data ready to be converted into images at this step.

