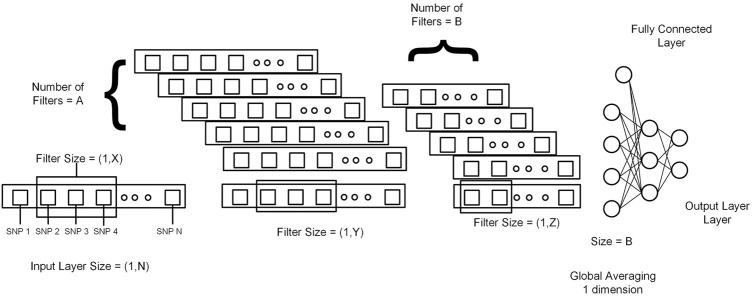
FIGURE 3.
Genotype data is presented in the form of a sequence from 1 to N (N = Total number of SNPs). X, Y, and Z represent the filter size for the first layer, second layer, and third layer, respectively. A and B represent the number of filters in the first layer and second layer. At the end output of the last 1DCNN layer, after global averaging, is connected to the fully connected network.

