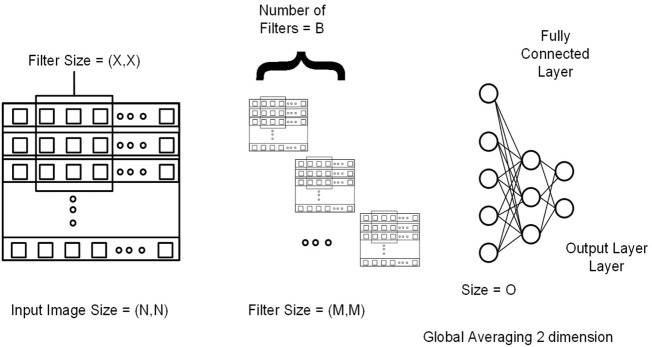
FIGURE 4.
Genotype data is presented in the form of a sequence image having dimension N by N (N*N = Total number of SNPs). M and X represent the filter size for the first and second convolutional layers, respectively. B represents the number of filters in the second layer. At the end output of the last 2DCNN layer, after global averaging, is connected to the fully connected network.

