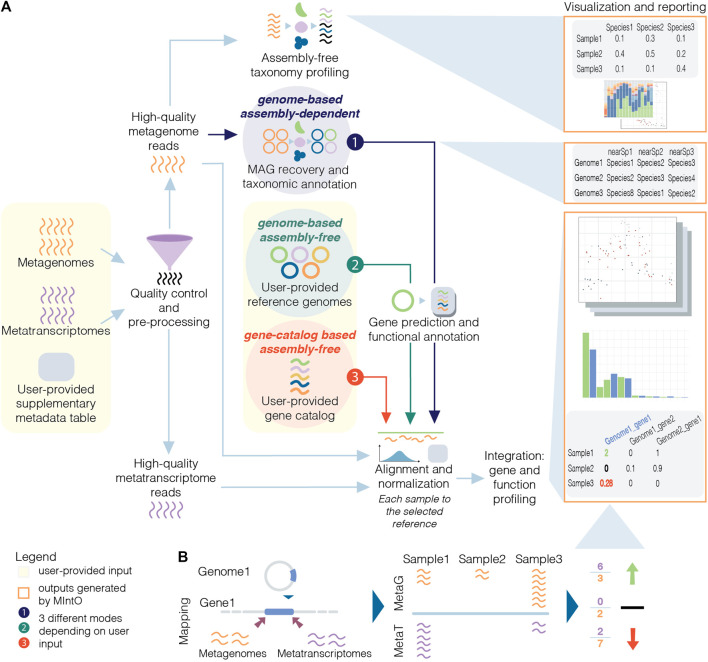
FIGURE 1.
Schematic overview of metagenomic and metatranscriptomic integration to quantify gene expression levels. (A) Three modes are available based on the input data and the experiment design: the genome-based assembly-dependent mode (1, in dark purple) recovers MAGs from metagenomic samples, while the genome-based assembly-free (2, in dark green) and the gene-catalog-based assembly-free (3, in red) modes use publicly available genomes or a gene catalog, respectively, provided by the user. In the three modes, the pipeline workflow includes quality control and preprocessing; assembly-free taxonomy profiling of high-quality metagenomic reads (in orange) by identifying phylogenetic markers (coloured); alignment of the high-quality reads to the selected reference and normalization; integration: gene and functional profiling; and visualization and reporting. The gene prediction and functional annotation step is run using the recovered MAGs (mode 1) or publicly available genomes (mode 2). (B) The variation of gene expression depends on the abundance of transcripts from the organisms in the community and/or by changes in the abundance of these members and their related genes (community turnover).

