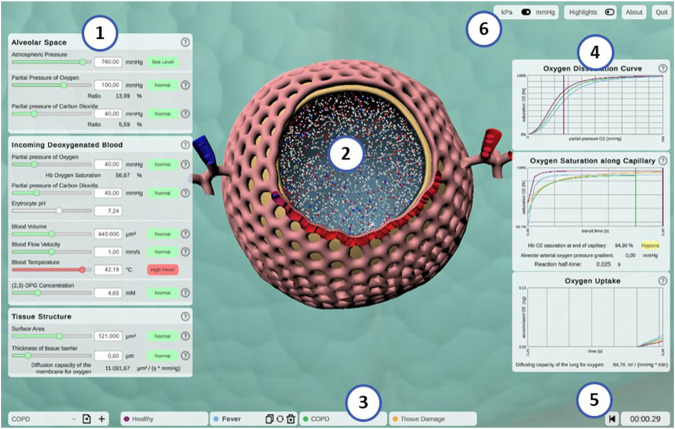
FIGURE 4.
Screenshot of the interactive application Alvin. (1) Model parameters are grouped in categories and can be configured by the user. Colors and information text provide possible real-world interpretation of the values. (2) Animated simulation of an alveolus for the active parameter set provides visualization of the effect of the model parameter values. (3) To increase exploratory value, multiple simulation instances can be compared. (4) Quantitative simulation output is displayed with plots color-coded for each active instance of the simulation. (5) Simulation time is displayed and can be reset. (6) Utility functions and settings are available.

