
Fig. 1.
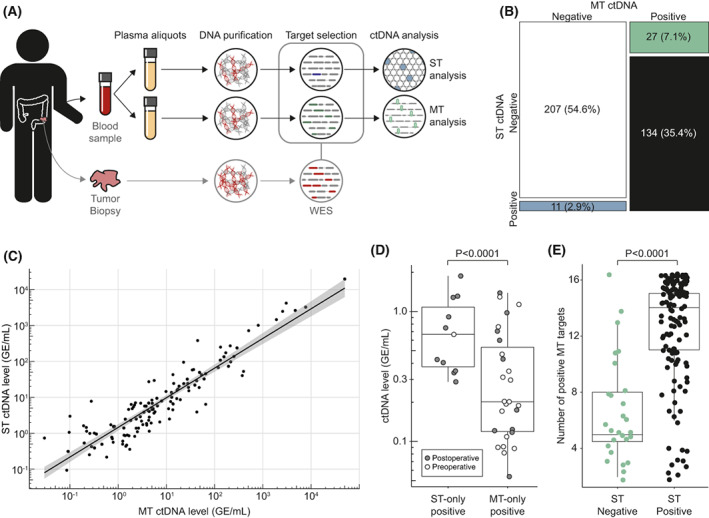
ctDNA call concurrence. (A) Overview of study design. (B) Mosaic plot of samples (N = 379) called positive or negative for ctDNA with a ST approach and/or MT approach. (C) Linear correlation between ctDNA level determined by ST and MT in samples called ctDNA positive with both methods (n = 134). Shaded area indicates 95% confidence interval for the linear fit. (D) Boxplot of ctDNA level in discordant samples estimated by the approach calling the sample ctDNA positive. Samples were subdivided into ST‐only positive (n = 11) and MT‐only positive (n = 27), and coloured according to sample timing. (E) Samples detected ctDNA positive by the MT‐approach (n = 161). Boxplot of the number of ctDNA‐positive targets detected by the MT approach shown for samples deemed either ctDNA negative (n = 27) or ctDNA positive (n = 134) with the ST approach. Boxplot whiskers in D and E indicate the 95% confidence interval.